


Screener
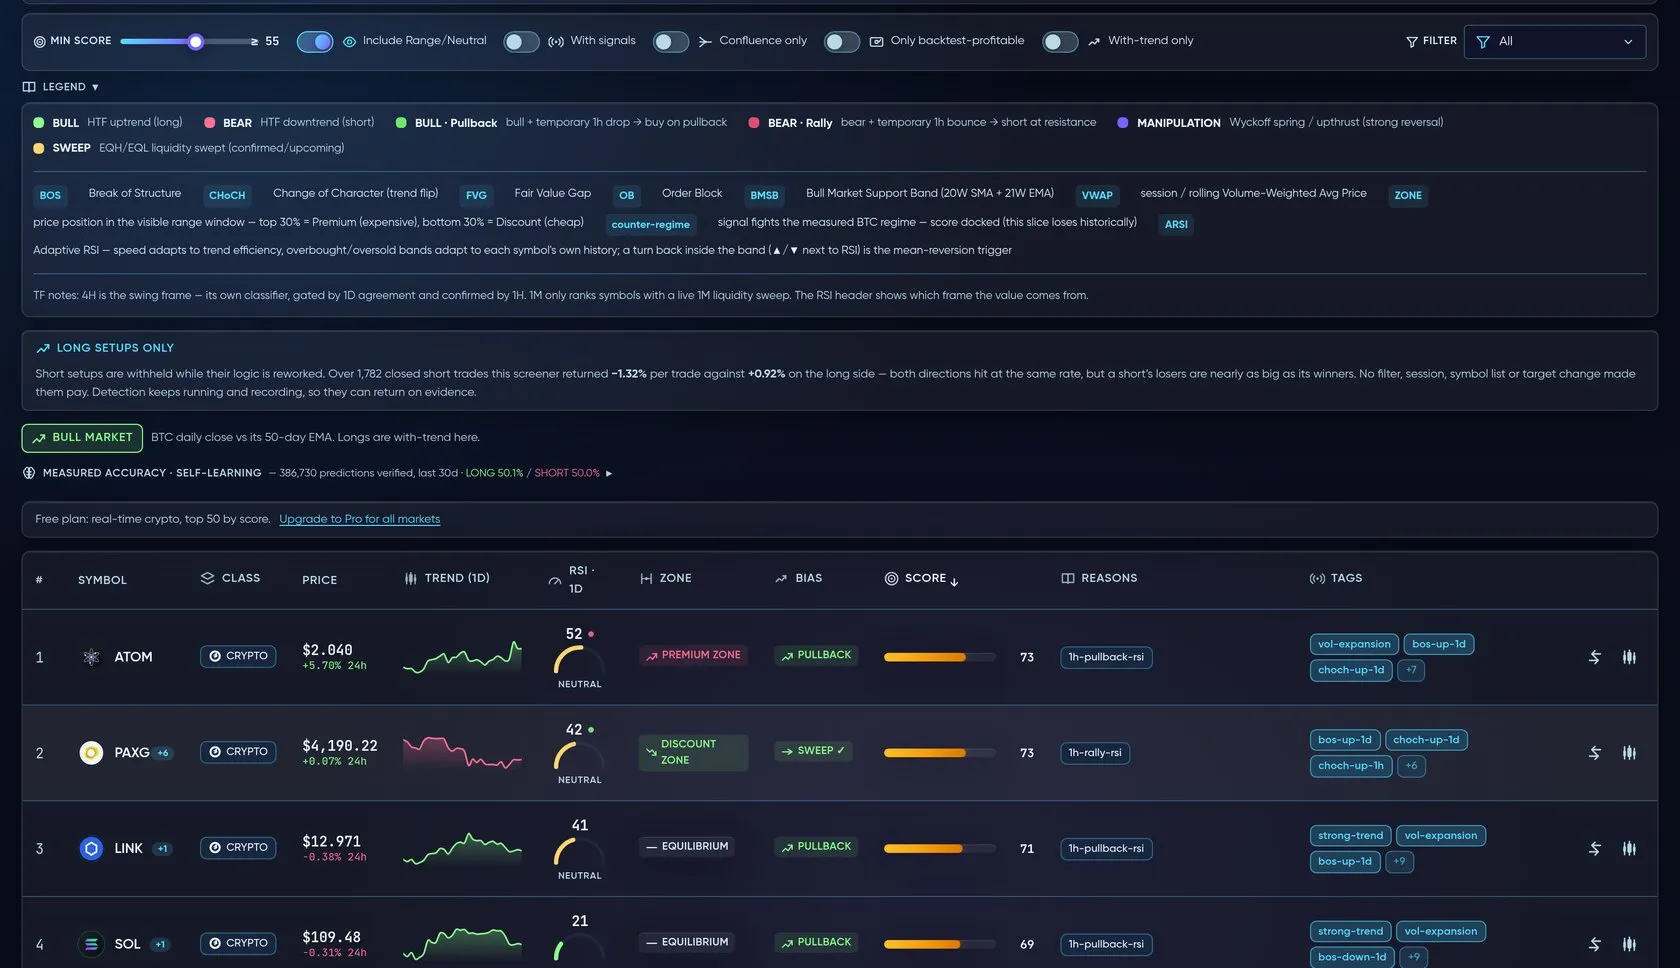
The Screener — every market, ranked by Formion's native scoring.
Live recording: scrolling the Screener — market chips, live feed, the ranked table, then a row's chart opened inline.
The Screener is Formion’s home view and the engine the rest of the app is built on: a ranked, sortable table of crypto, stock and forex markets, each scored by native signals rather than a single indicator.
Open it at app.formion.ai — it’s the first thing you see.
How scoring works
Section titled “How scoring works”Trend, momentum, volume, volatility and signal tags combine into one score and a bull / bear / neutral bias.
Every symbol gets one composite score:
- Trend, momentum, volume and volatility — live prices are scored on all four, then deduplicated across timeframes into one number per symbol
- Signal tags — structure and flow events such as FVG / order-block entries, VWAP reclaims and rejections, break of structure / CHoCH, regime changes, Wyckoff springs and Adaptive-RSI turns
- Bias — each row is classed bull, bear or neutral
The table shows score, price, 24h change, the strongest signals and a mini sparkline per row. Sort by any column and filter by asset class (crypto, stocks, forex), bias and signal, so you can jump straight to “what’s set up right now”.
Sub-tools
Section titled “Sub-tools”Live recording: switching between Bias Map, Radar, Hunt, Consensus and Watchlist.
Bias Map
Section titled “Bias Map”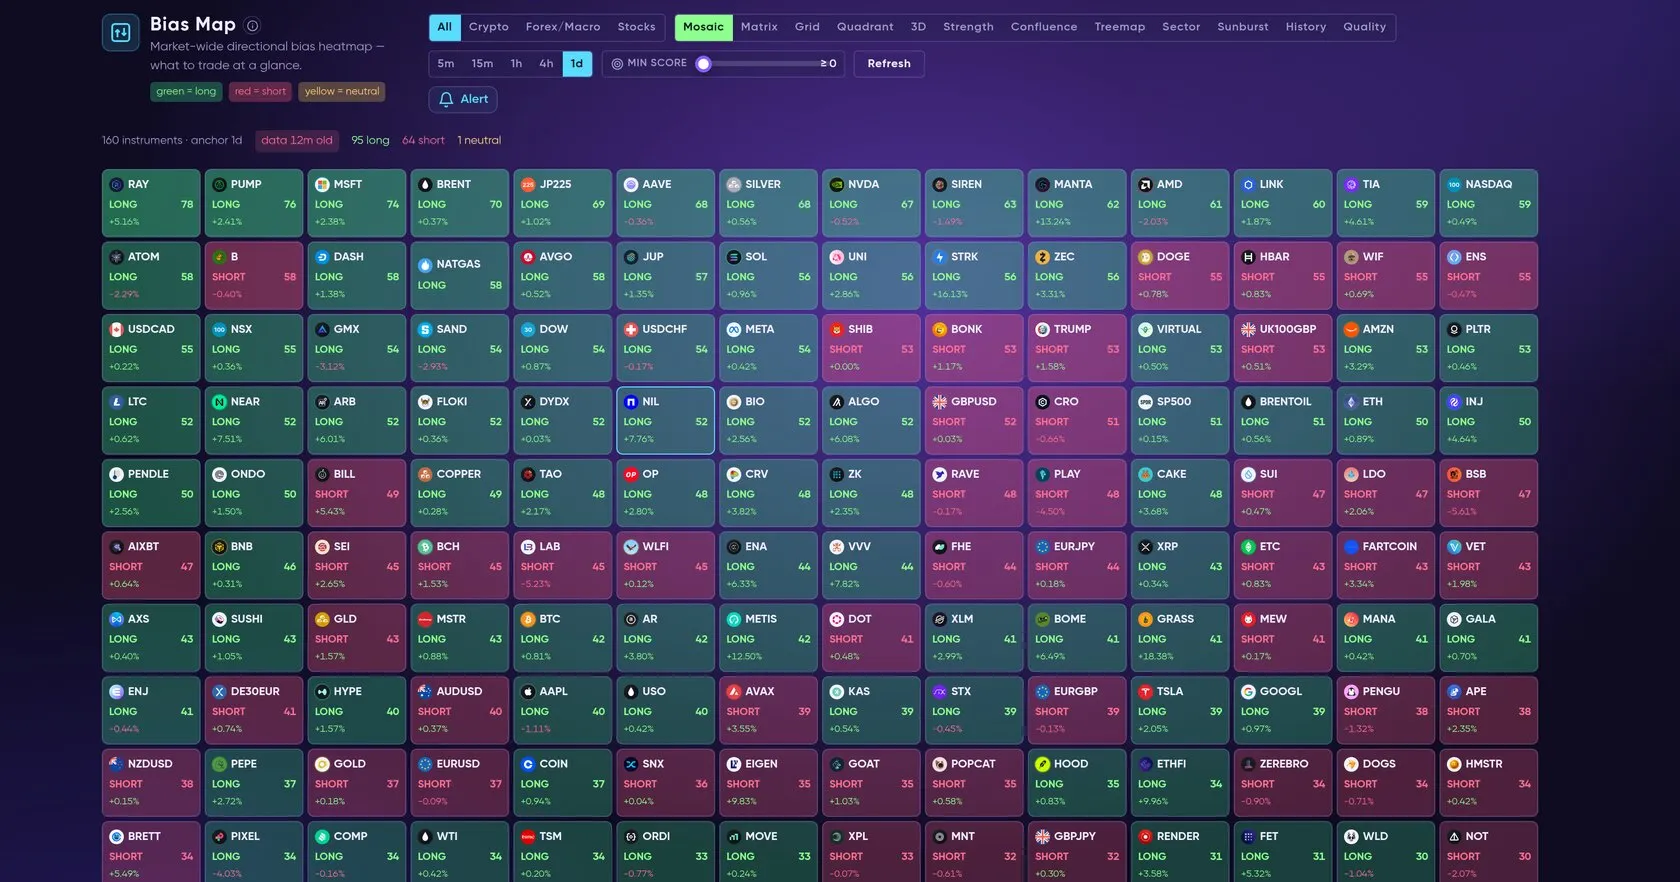
Bias Map: green = long bias, red = short, by timeframe.
A market-wide directional bias heatmap across 5 timeframes (5m → 1d) with a selectable anchor timeframe. Green = long bias, red = short, yellow = neutral. Twelve views (Mosaic, Matrix, Grid, Quadrant, 3D, Strength, Confluence, Treemap, Sector, Sunburst, History, Quality) and a Min-Score slider let you read the whole market’s lean at a glance.
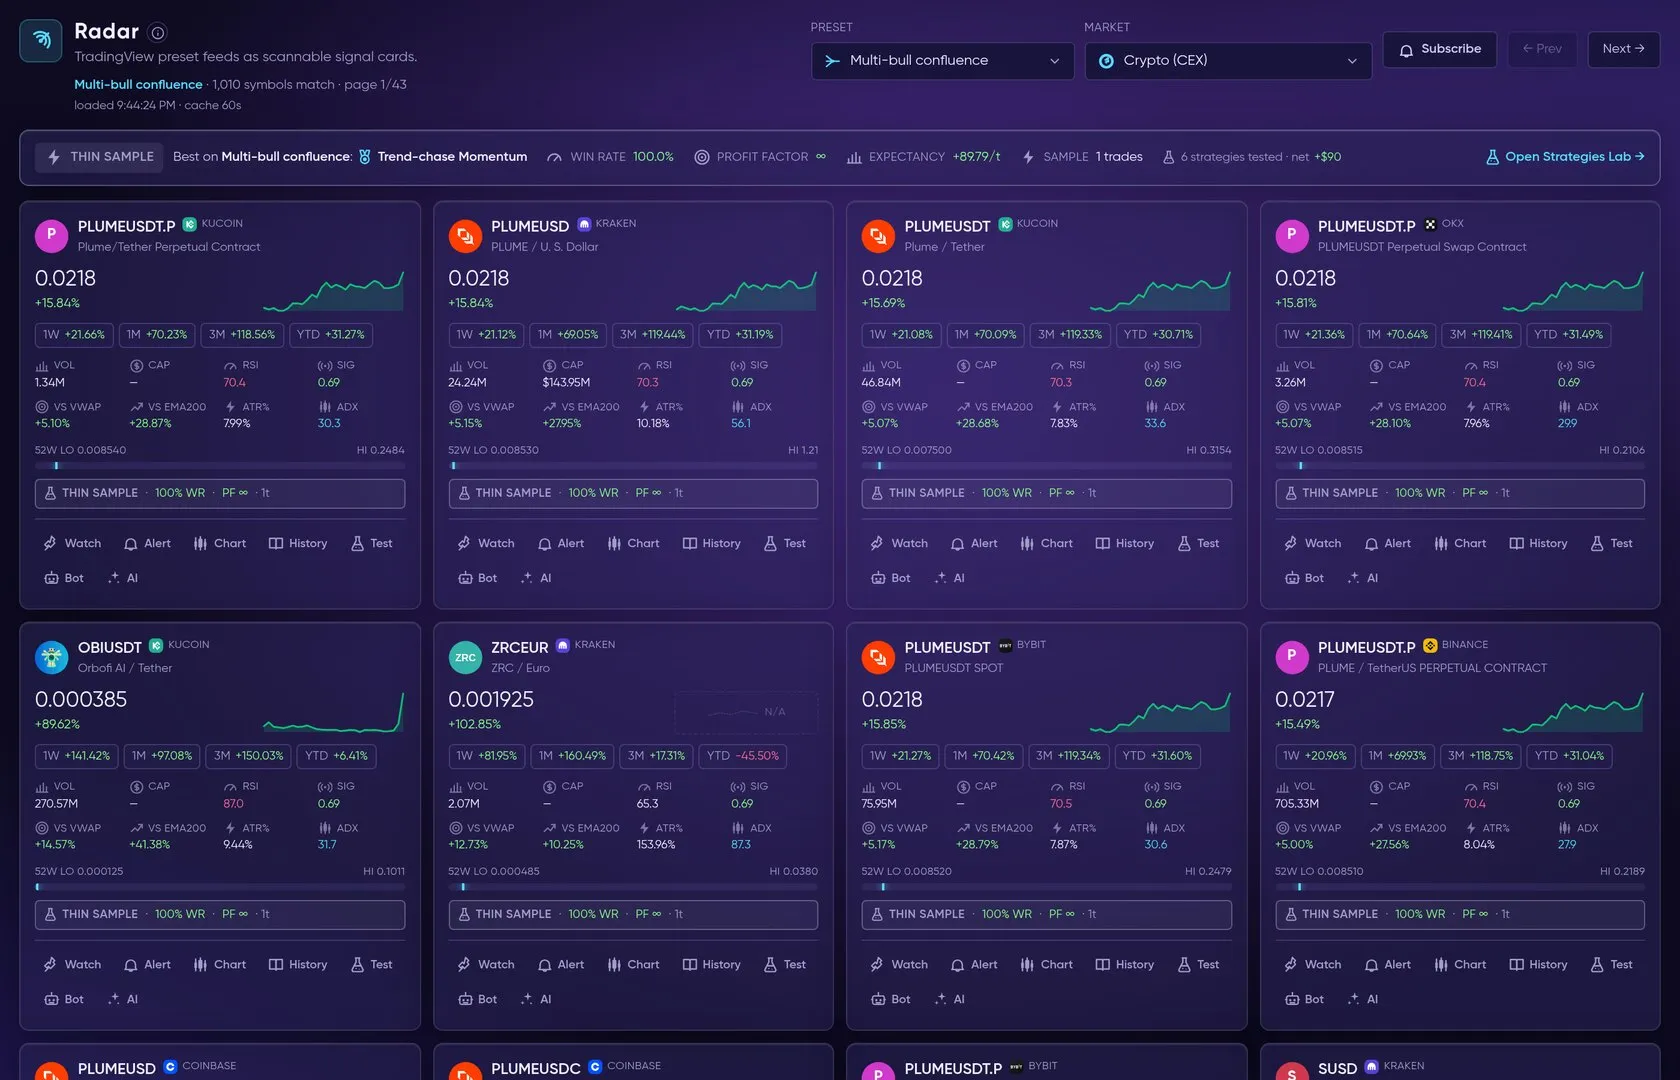
Radar: preset scans rendered as signal cards.
30+  TradingView preset scans (movers, breakouts, trend shifts, volume…) rendered as signal cards, across crypto, forex, indices/CFDs and stock markets (US, Canada, UK, Germany, France, Japan, Hong Kong, India, Australia). Subscribe to a preset to be alerted on fresh matches.
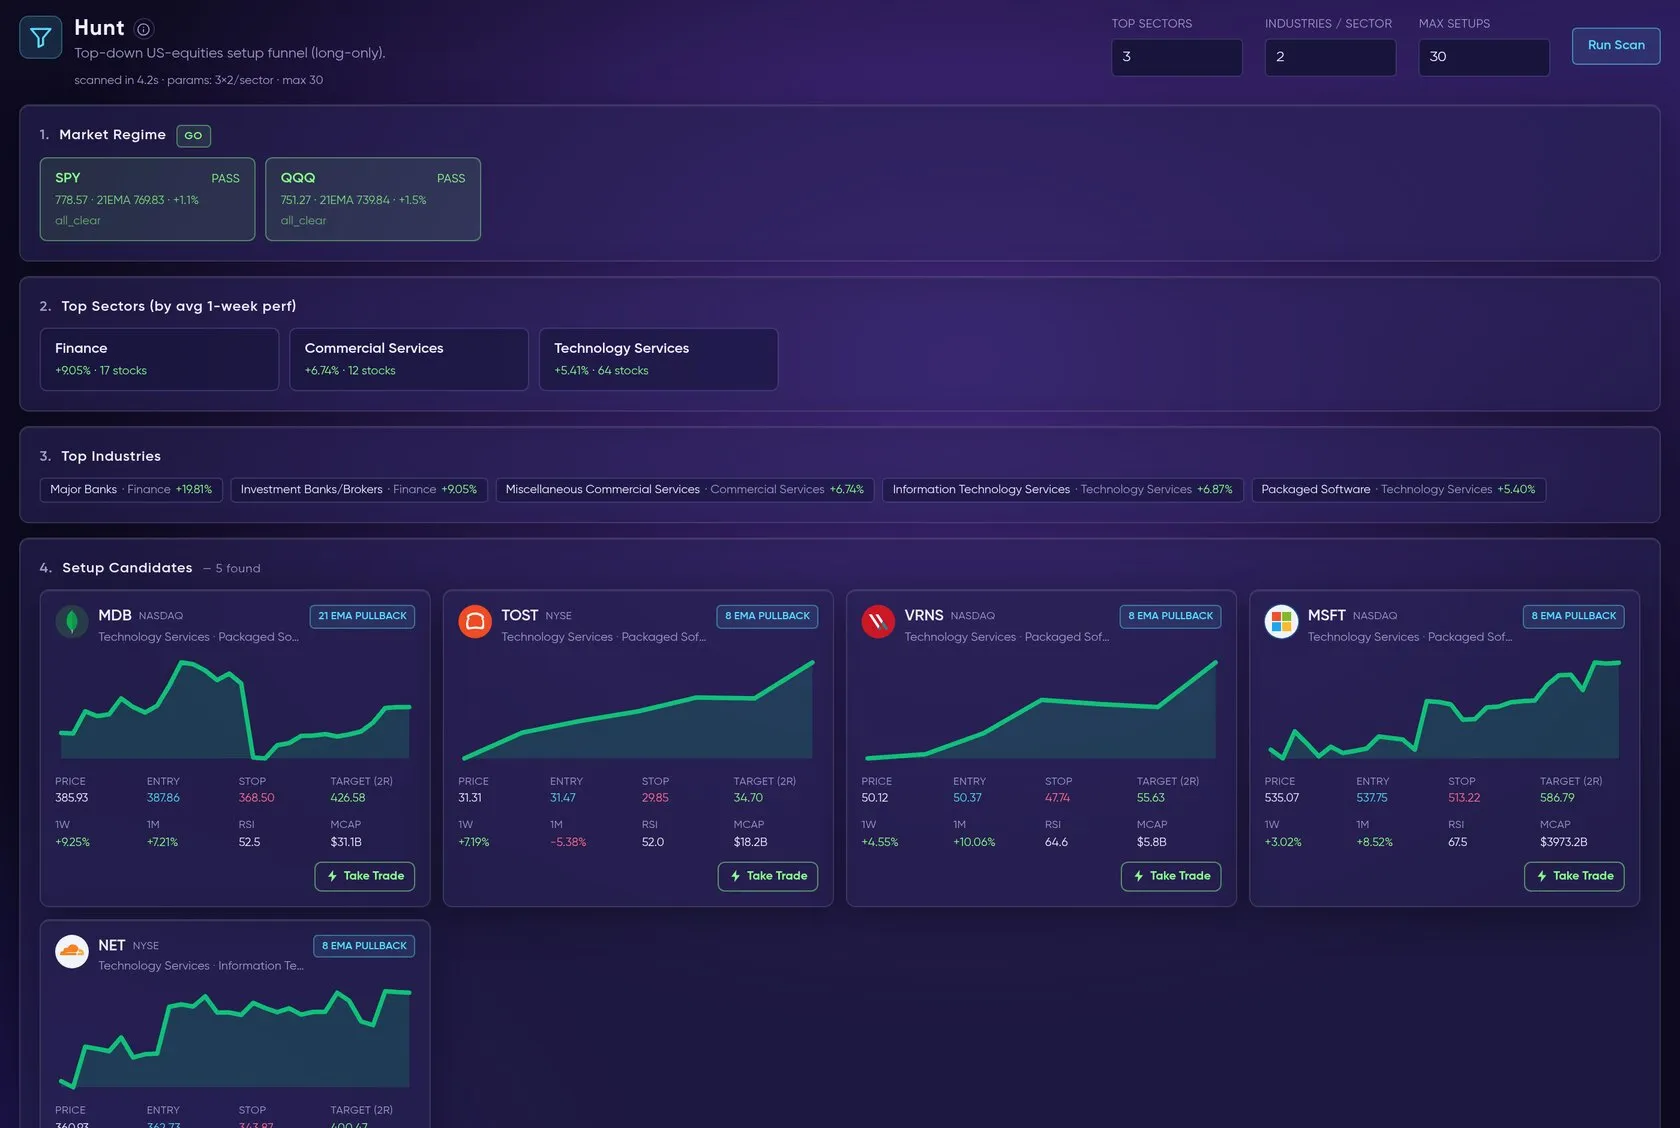
Hunt: market regime → top sectors → top industries → setup candidates.
A top-down US-equities setup funnel (long-only): market regime ( SPY/QQQ vs their 21/50 EMAs) → strongest sectors → strongest industries → ignition-and-flag and 8/21-EMA pullback setups, each with entry, stop and a 2R target.
Consensus
Section titled “Consensus”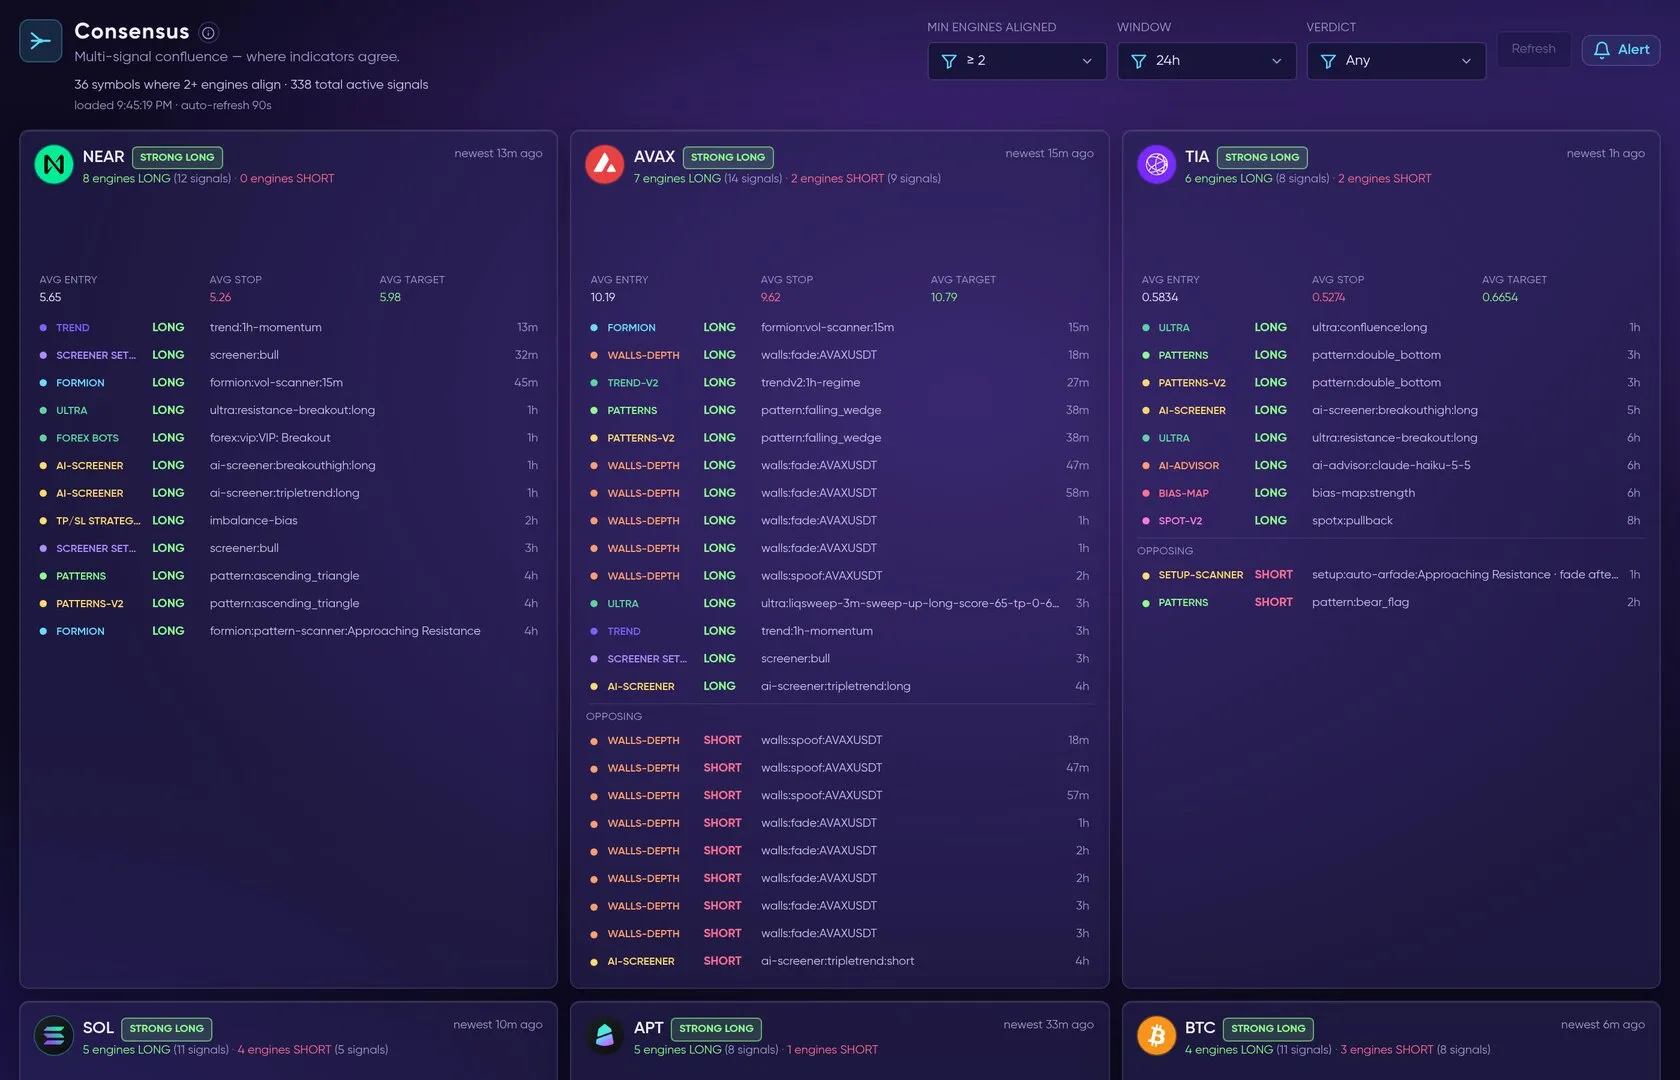
Consensus: symbols ranked by how many engines agree on the same direction.
Multi-signal confluence: symbols ranked by how many of Formion’s engine families agree on the same direction.
- Status: Context signal · Collecting data. Engines agreeing is context next to your own levels and trend — our study has not shown that agreement alone trades better, so Consensus is not a buy/sell signal.
- Counted by family, not by variant. Several variants of one engine count as one vote, so one engine with many versions cannot inflate the score. The rows still list every variant.

The status note on the Consensus page: Context signal · Collecting data, votes counted per engine family, Talos counted once.
- Talos is counted once. The Talos copy trades used to reach Consensus through two readers; they are now one family and one trade.
Watchlist
Section titled “Watchlist”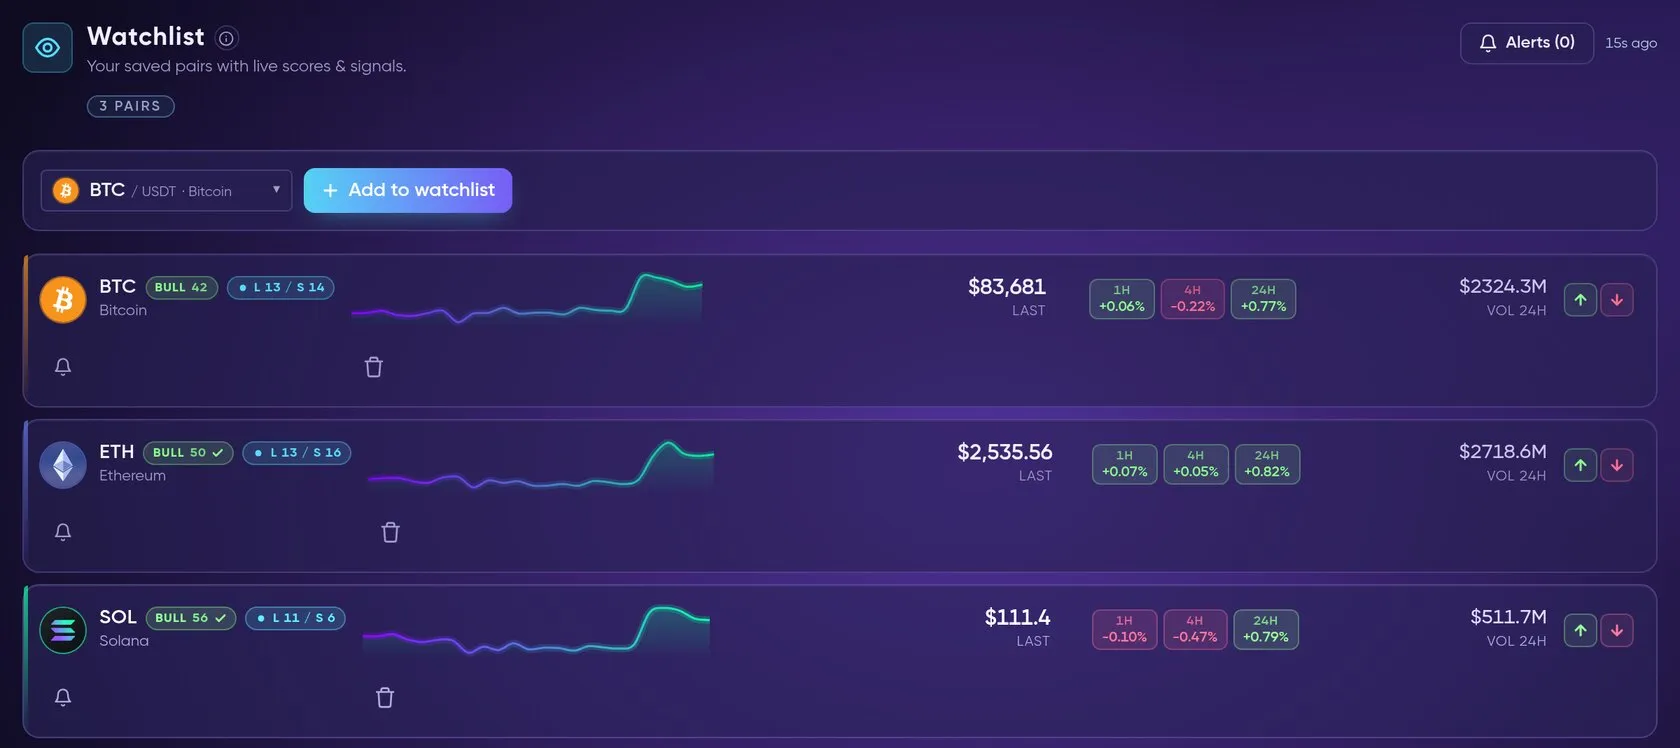
Watchlist: your saved symbols with live bias, price and volume.
Your saved symbols with live scores and signals, plus a workspace to curate the list against a live multi-timeframe bias matrix.
More lenses
Section titled “More lenses”Patterns (chart-formation detector), Trend (trend-strength scan, see below), Arbitrage (cross-exchange price spreads and funding carry), Order Book (resting bids vs asks near price and walls, see below), VWAP Bubble, RSI Heat, MACD Heat and EMA Cloud.
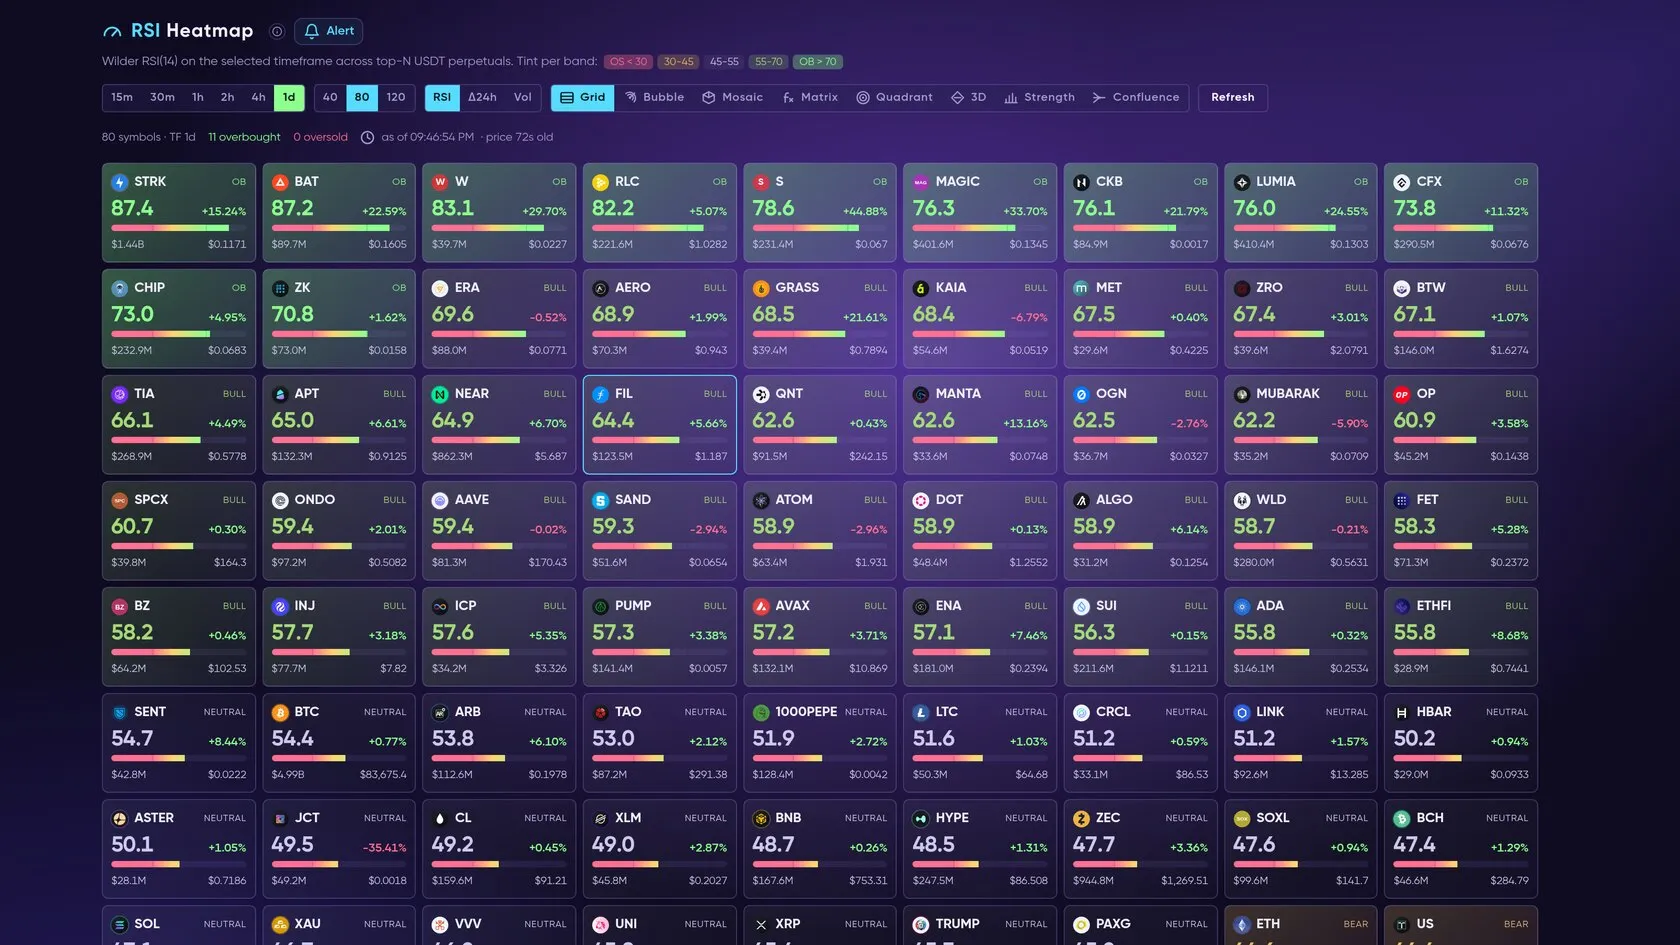
RSI Heatmap — every symbol coloured by RSI.
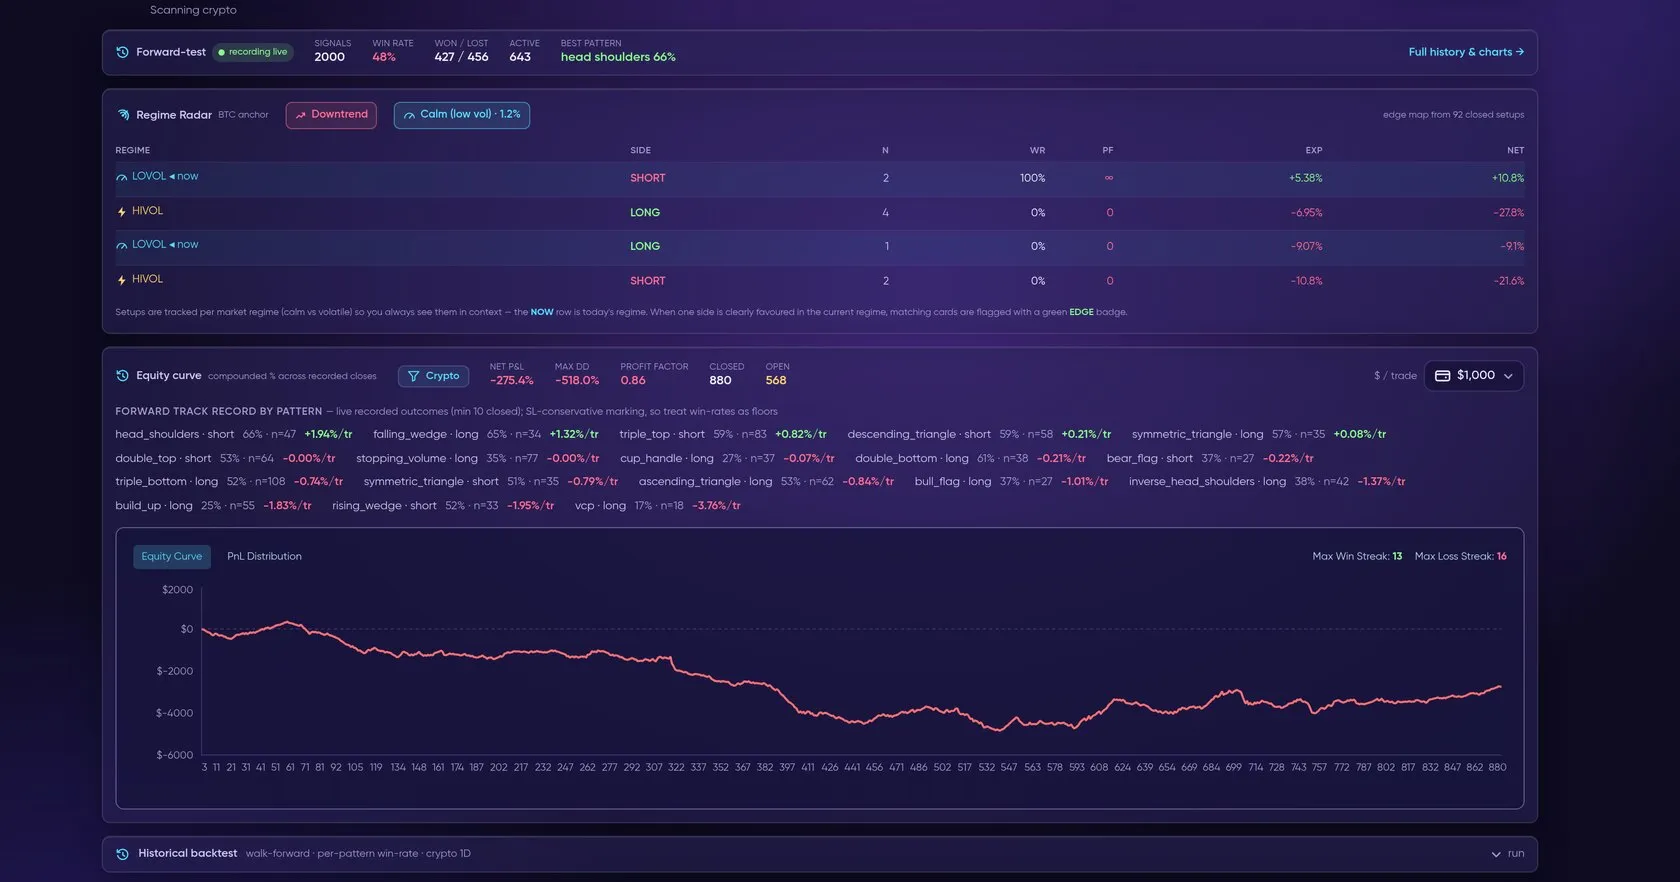
Patterns: detected formations, regime radar and a forward-tested track record by pattern.
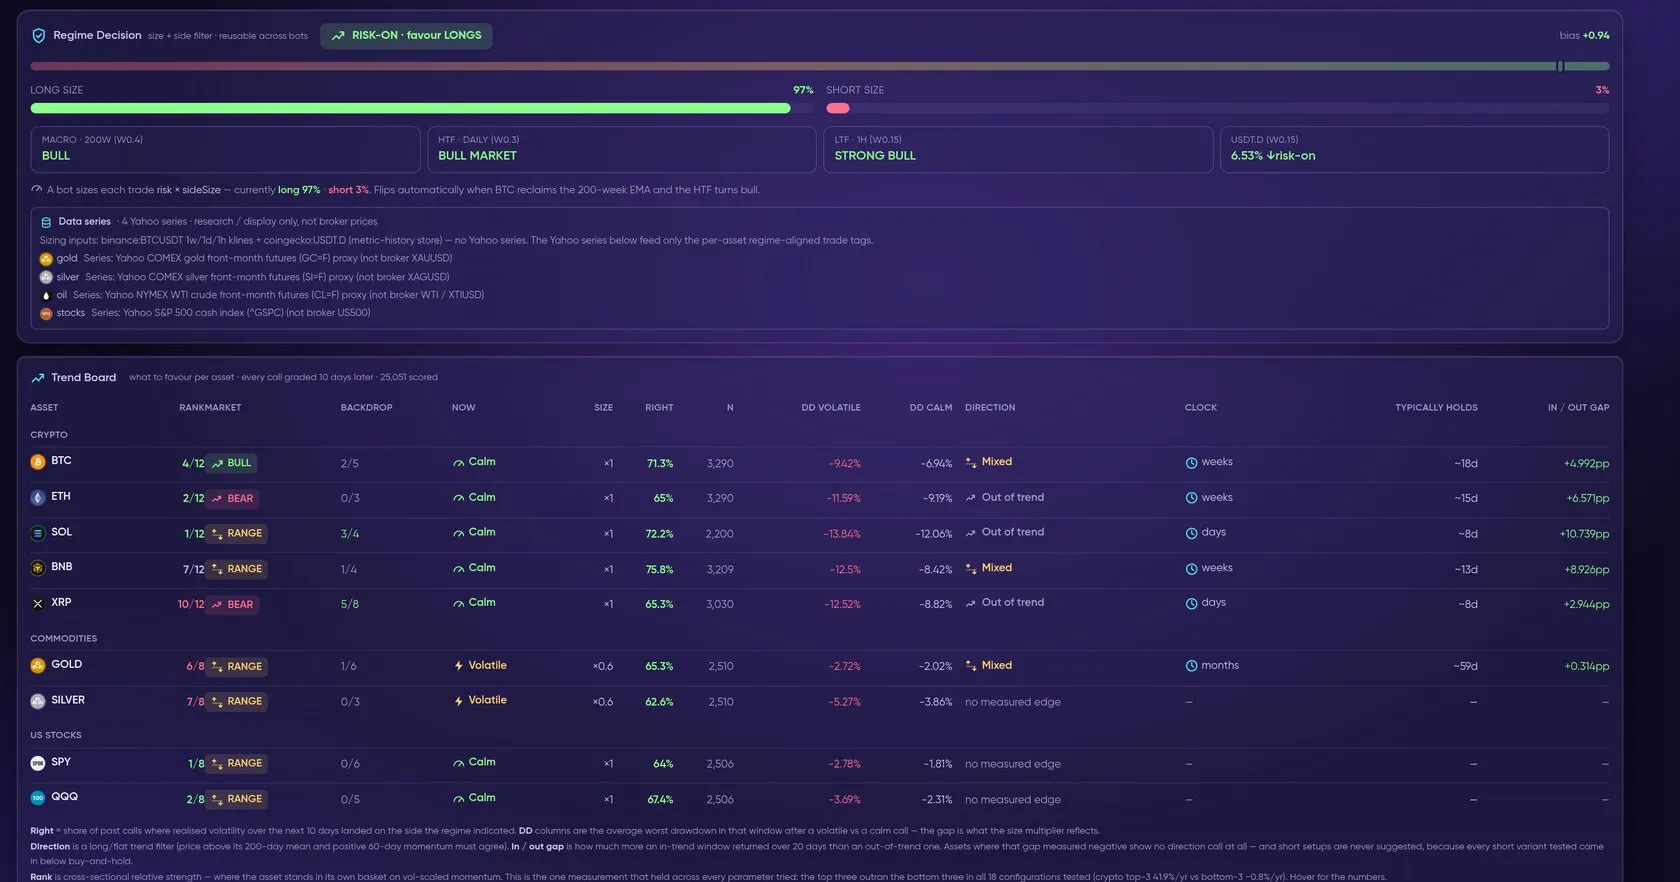
Trend: regime decision plus a trend board across crypto, commodities and US stocks.
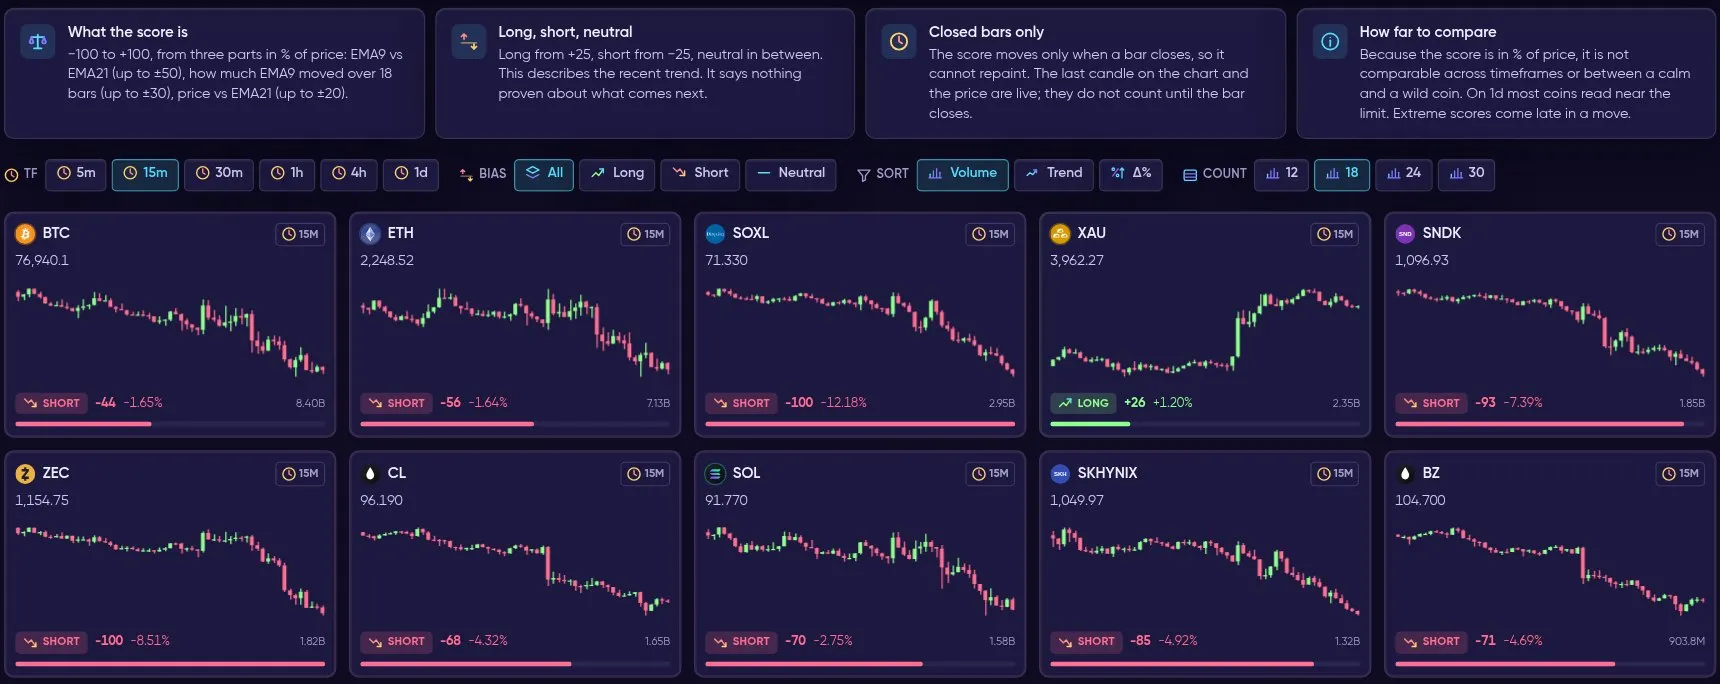
Trend scanner: one card per coin with its score and bias, on closed candles only.
The Trend scanner gives every coin ( Binance USD-M perpetuals, top by 24h volume) a trend score from −100 to +100 on the timeframe you pick (5m → 1d):
- Score — built from three parts, all in % of price: EMA9 vs EMA21 (up to ±50), how much EMA9 moved over the last 18 bars (up to ±30) and price vs EMA21 (up to ±20).
- Bias — Long from +25, Short from −25, Neutral in between. It describes the recent trend; it says nothing proven about what comes next.
- Closed candles only — the score, bias and change % move only when a candle closes, so a signal never repaints. The last candle on the chart and the price are live, but they do not count until that candle closes.
- How far to compare — because the score is in % of price, the same number is not comparable across timeframes or between a calm and a wild coin.
- Renamed or dead symbols show no score — a symbol whose market stopped trading or was renamed (for example TON → GRAM, MATIC → POL) shows no score and a “Renamed to …” note, never a fake “neutral 0”.
Trend backtesting (paper book). The Backtesting sub-tab measures a paper book that takes trades from the trend score on 1h. Entries, stops and targets are Formion’s own rules (ATR-based), not anyone’s signal. How the book is measured:
- A signal fires only on a just-closed 1h candle.
- Entry is the real executable price at that moment (ask for long, bid for short).
- Exits are taken at the real exchange price: a stop fills at the first real trade after it is triggered, a target fills only when price trades through it, and a time expiry closes at the last real trade price.
- Results are shown after costs (editable) and include the funding actually charged.
- Measurement restarted on 2 Nov 2026. Old rows whose recorded outcome was contradicted by exchange data were removed, so the default view starts from the restart.
- Free users see the last 7 days, Pro and up the whole book. Until there are at least 30 trades over at least 14 days the status reads Collecting data.
Order Book
Section titled “Order Book”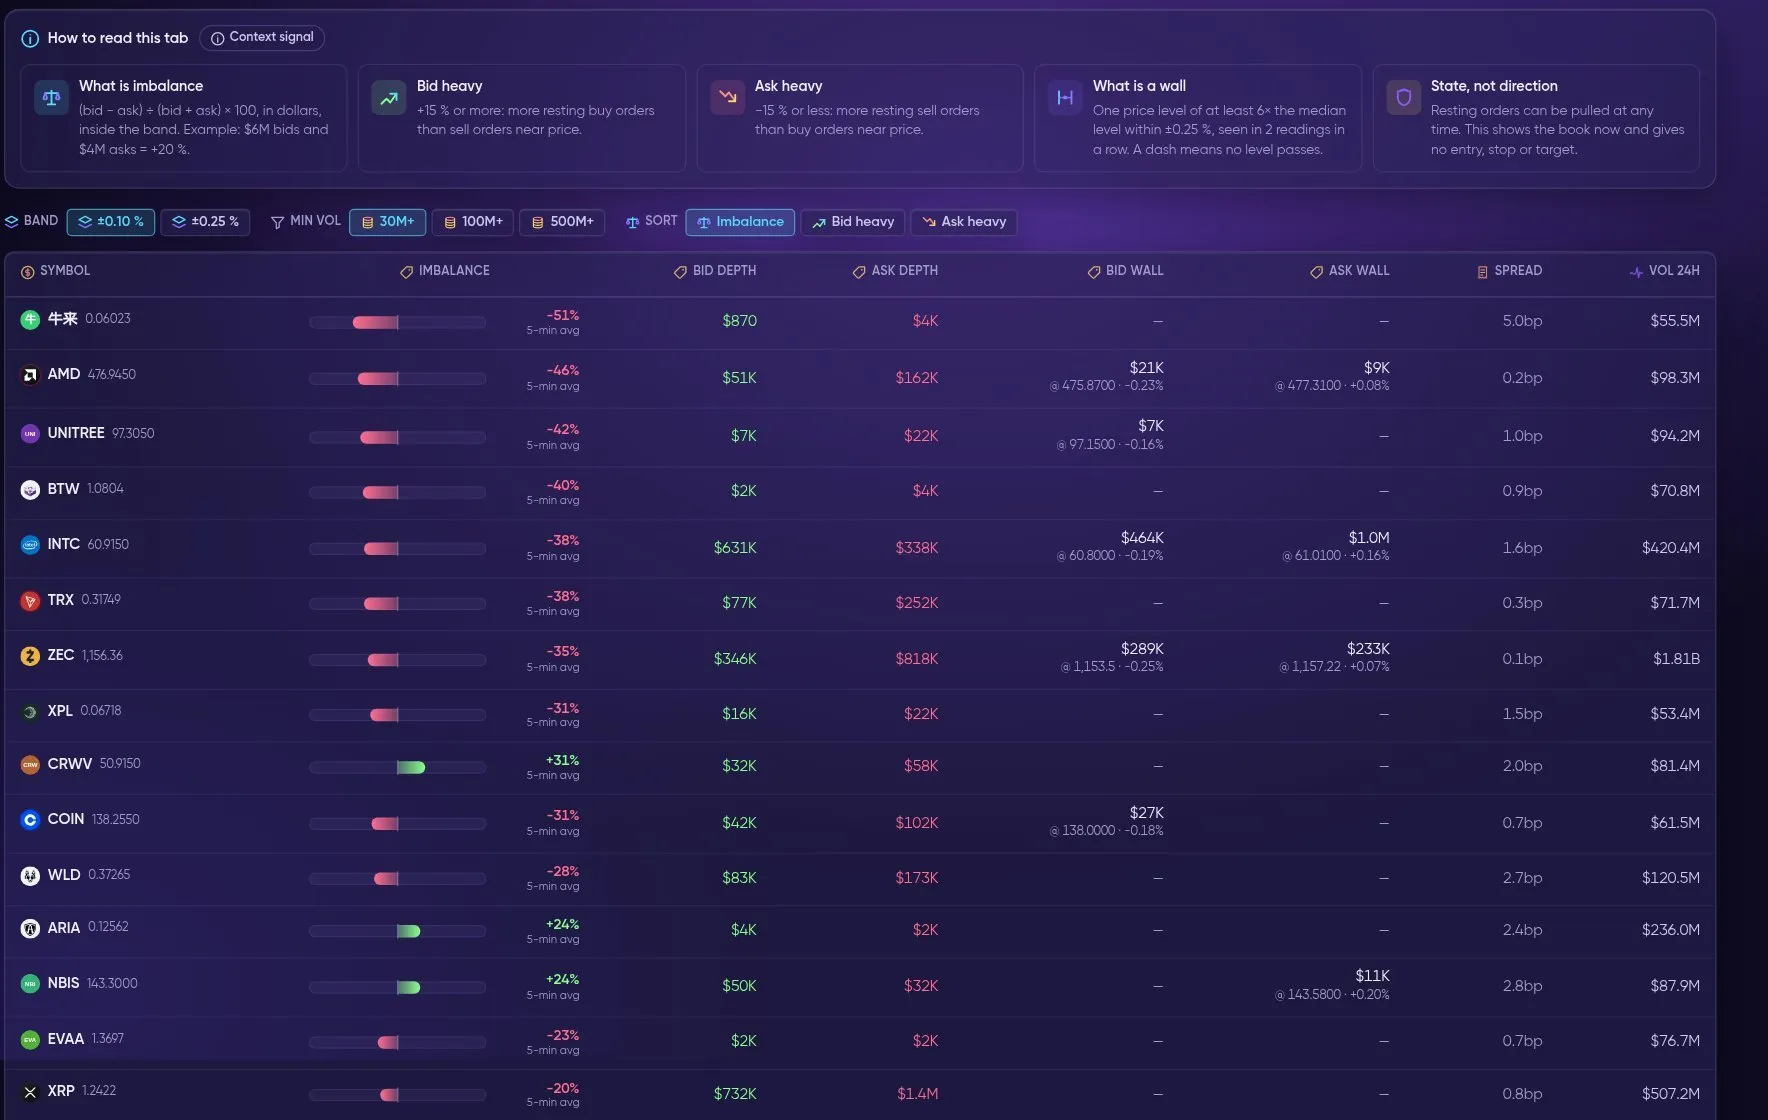
Order Book: resting bids vs asks near price (5-minute average), walls, spread and volume for the top 80 coins.
The Order Book tab shows how the resting orders near the current price are split between buyers and sellers, for the top 80 Binance USD-M perpetuals by 24h volume. It is a Context signal: it shows the state of the book now, not where price will go, and it never gives an entry, stop or target.
- Imbalance = (bid − ask) ÷ (bid + ask) × 100, in dollars of resting orders within ±0.10 % of the mid price. Switch to ±0.25 % with the Band filter. That wider band is shown only when the book actually reaches it; otherwise the cell shows “—”. Every coin is measured over the same price distance, so the numbers are comparable.
- The main number is a 5-minute average, not a single snapshot, because the book changes second by second. Until five readings exist, the row says “warming up”.
- Bid heavy = +15 % or more (more resting buy orders near price), Ask heavy = −15 % or less, Balanced in between.
- Wall = one price level at least 6× the median level within ±0.25 %, seen in 2 readings in a row. If no level passes, the cell shows “—”. The biggest level on its own is not called a wall.
- Resting orders can be pulled at any time. A wall or a heavy side describes the state of the book, not a direction.
- All users share one snapshot of the book. If it is older than about 2.5 minutes, the tab shows a stale warning instead of “Live”.
Walls Bot & Backtesting
Section titled “Walls Bot & Backtesting”The Backtesting sub-tab (also opened from Walls Bot →) measures what happens when price touches a wall:
- Walls v2 has been measured from 2 Nov 2026 on Binance USD-M perpetuals with real fills. A trade exists only when a real trade print touches a confirmed wall. The entry is the first real print on the taking side, i.e. at the bid or ask, 1–6 s after the touch. The stop is checked on the real trade path and fills at the first real trade after it is hit. The target fills only when price trades through it. Results are net of fees, slippage and real funding.
- The stop and target levels are Formion’s own strategy rules (based on 1-hour ATR), not levels from the book or from any trader.
- v1 is an archive (an older, simpler measurement). It is shown below v2 and labelled “archive v1, not directly takeable”.
- Filters (side, session, days, coin and more) work over the whole book. Every filter shows a status:
- Too few data — not enough trades or days yet
- Collecting data
- Past only, fades recently — positive in the past but not recently
- Holds in both halves — positive after costs in both halves of the period and recently
- The first verdict needs at least 30 trades and at least 14 days. Until then, v2 reads Collecting data.
- Who sees what: you need to be logged in. Free users see the last 7 days, and Pro and up see the whole book.
Context data — Volume z and Volatility regime
Section titled “Context data — Volume z and Volatility regime”Two extra readings sit next to the strength of every crypto row. They are context data: they describe the state of the market right now. They are not buy or sell signals and they are not part of the strength score — the ranking, phases and counts are exactly the same with or without them.
| Reading | What it is | How it is measured |
|---|---|---|
| Volume z | How unusual the volume of the last closed bar is | (volume of the last closed bar − average of the previous 20 closed bars) ÷ their standard deviation, on the screener timeframe you picked. +2 means about two standard deviations above normal; −1 means quieter than usual |
| Volatility regime | How wild the coin is now compared with its own recent past | 24 h realized volatility (1 h bars, annualised) as a percentile of the coin’s own last 30 days: Compressed below P20 · Normal P20–P80 · Elevated above P80 · Extreme above P95. Hover the P number for the realized and Parkinson volatility |
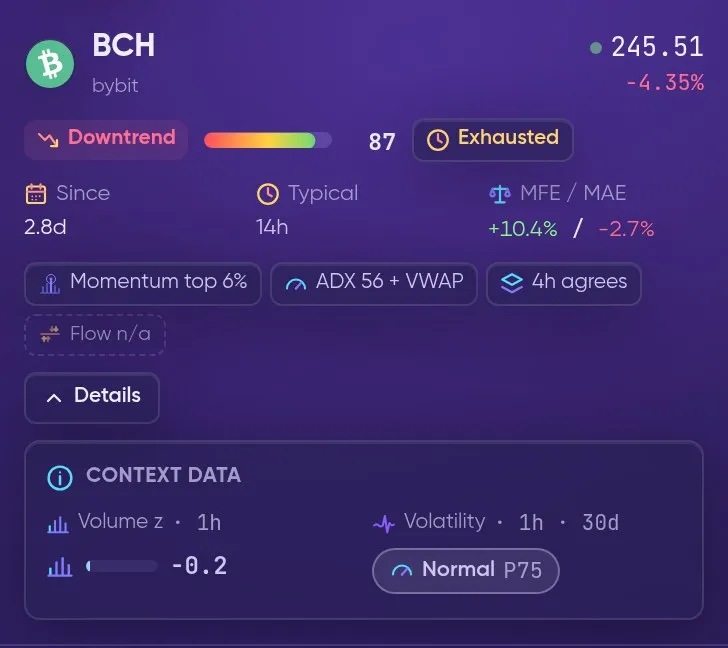
Details on a phone: the Context data block with Volume z on the screener timeframe (here −0.2 on 1h) and the Volatility regime (here Normal, P75 of the last 30 days).
Where you see them
Section titled “Where you see them”- Details — open a row (desktop) or tap Details on a card or a phone row. The Context data block shows both readings with their timeframe, for example
Volume z · 1handVolatility · 1h · 30d. - Columns — the Columns button adds Volume z and Volatility as optional table columns. They are off by default; your choice is remembered in this browser, like the view and the number of rows.
- More filters · context data — in the filter panel (closed by default). Filter by Volume z ≥ 2, Volume z ≥ 3 or Volume z ≤ −1, and by regime: Compressed, Normal, Elevated, Extreme or Elevated + Extreme. Rows without a fresh value are left out while a filter is on, and the up/down counters follow the filter.
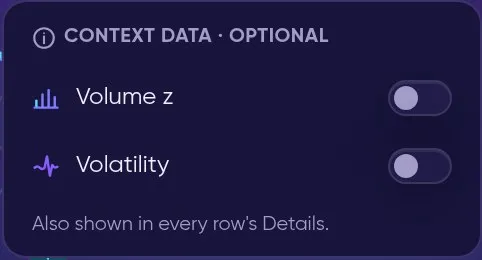
Columns: the two optional context columns, off until you switch them on.

More filters · context data: Volume z and Volatility regime filters.
Good to know
Section titled “Good to know”- Coverage: both readings are measured on
 Bybit perpetual candles, so they exist for about 88 % of crypto rows. A market without them (for example a coin listed only on Binance) shows — with an explanation. A new coin needs at least 7 days of hourly history before it gets a regime (Collecting).
- No stale numbers: a Volume z older than 3 bars or a regime older than 3 hours is not shown.
- Information only: we measured whether the volatility regime makes signals better when used as a filter — it does not. Use it to understand the market you are looking at (a quiet coin vs a coin in an extreme move), not as a reason to enter or skip a trade.
Logos & live data everywhere
Section titled “Logos & live data everywhere”Every symbol carries its asset logo, and rows update live. Click any row to open its full chart and analysis in Chart Pro.