


Order Flow & Microstructure
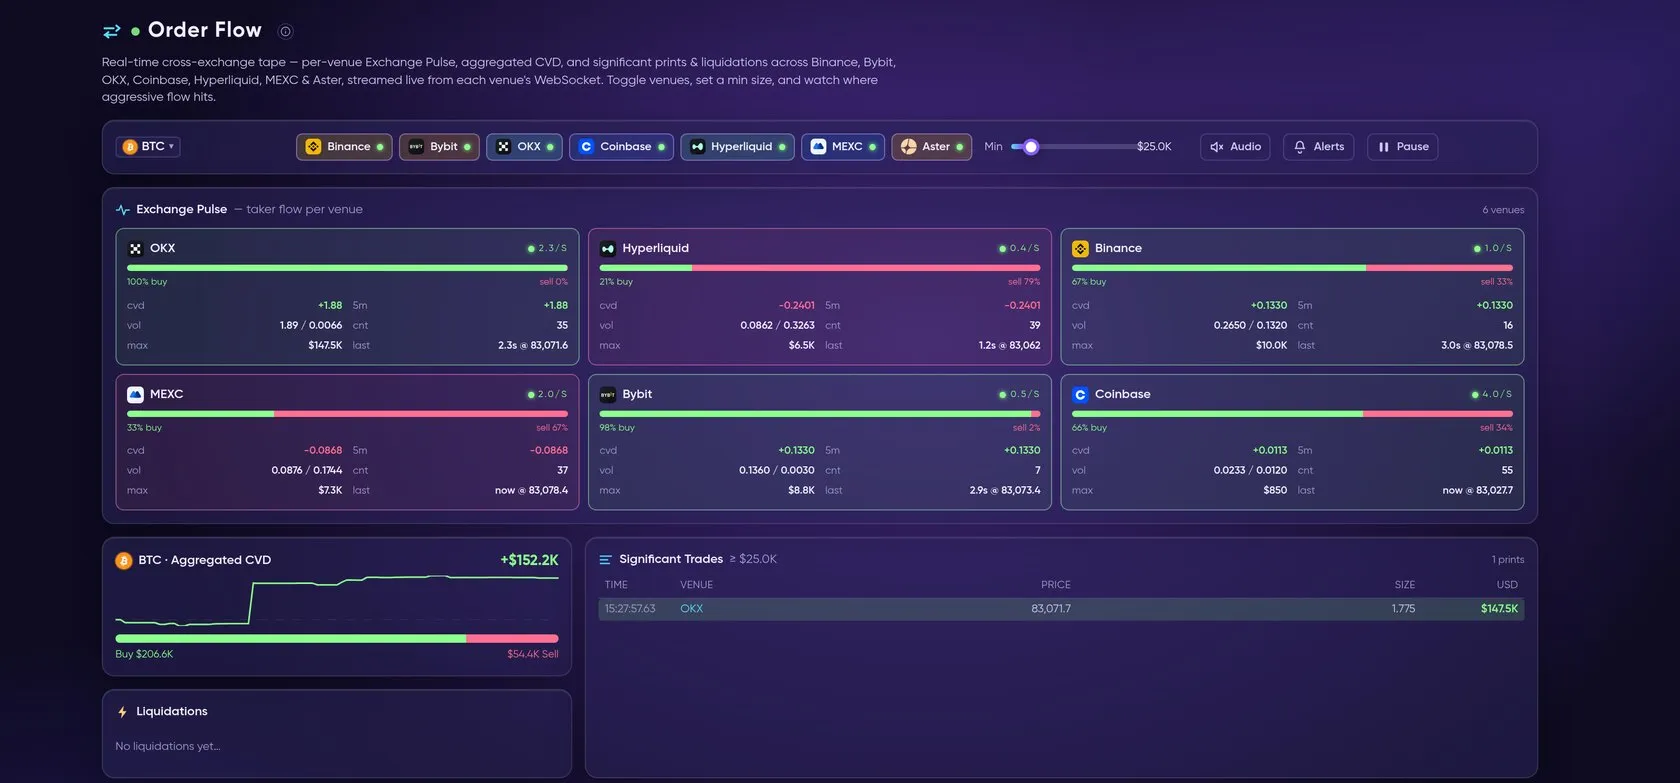
Live recording: Data Hub → Order Flow, Orderbook Heatmap, DOM Pro, Liquidation Map and Walls.
See what’s happening inside the candle. Formion ships a full market-microstructure suite — the order-book, the tape, large trades, liquidations and where the big resting orders sit — across multiple exchanges.
The tools
Section titled “The tools”| Tool | What it shows |
|---|---|
| Order Flow | Trades and liquidations streamed from  Binance,  Bybit,  OKX and  Coinbase, with an aggregated CVD and a Significant Trades feed. Filter prints by USD size or by relative size (×2 / ×5 / ×10 the average print); prints of ×10 or more are marked BLOCK. See Relative size filter below |
| Tape Feed (Time & Sales) | Every print in real time (Constructor panel) |
| DOM Pro | A depth-of-market ladder with a size heatmap, a trade heatmap and VWAP / POC / VAH / VAL levels |
| Liquidity Map | Recorded resting liquidity over time, summed across 11 markets, with tracker, ladder, pull/stack, walls, CVD and  Hyperliquid liquidation levels. It replaces the old Order-Book Heatmap and Agg Heatmap pages — see Liquidity Map |
| Footprint | Bid/ask volume inside each candle by price tick (Constructor panel) |
| Walls | Live wall detector plus a history of confirmed, broken and pulled walls. A wall is resting liquidity that can be pulled at any time, so it is context, not a support or resistance promise. The Walls Bot paper book (v2, real fills, measured from 2 Nov 2026) and its Backtesting filters are described under Screener → Order Book |
| Liquidation Map | A model estimate of where leveraged positions would be force-closed, over time — magnet levels, with a leverage filter. See Liquidation Map below |
| HL Trade Intent (preview) | A pane under the chart in Chart Pro: per bar, how many dollars of new longs and new shorts were opened on Hyperliquid, and on request how many longs and shorts were closed. See HL Trade Intent below |
| Spoof / Iceberg detector | Flags levels cancelled without being filled and levels that refill after being eaten (Constructor panel) |
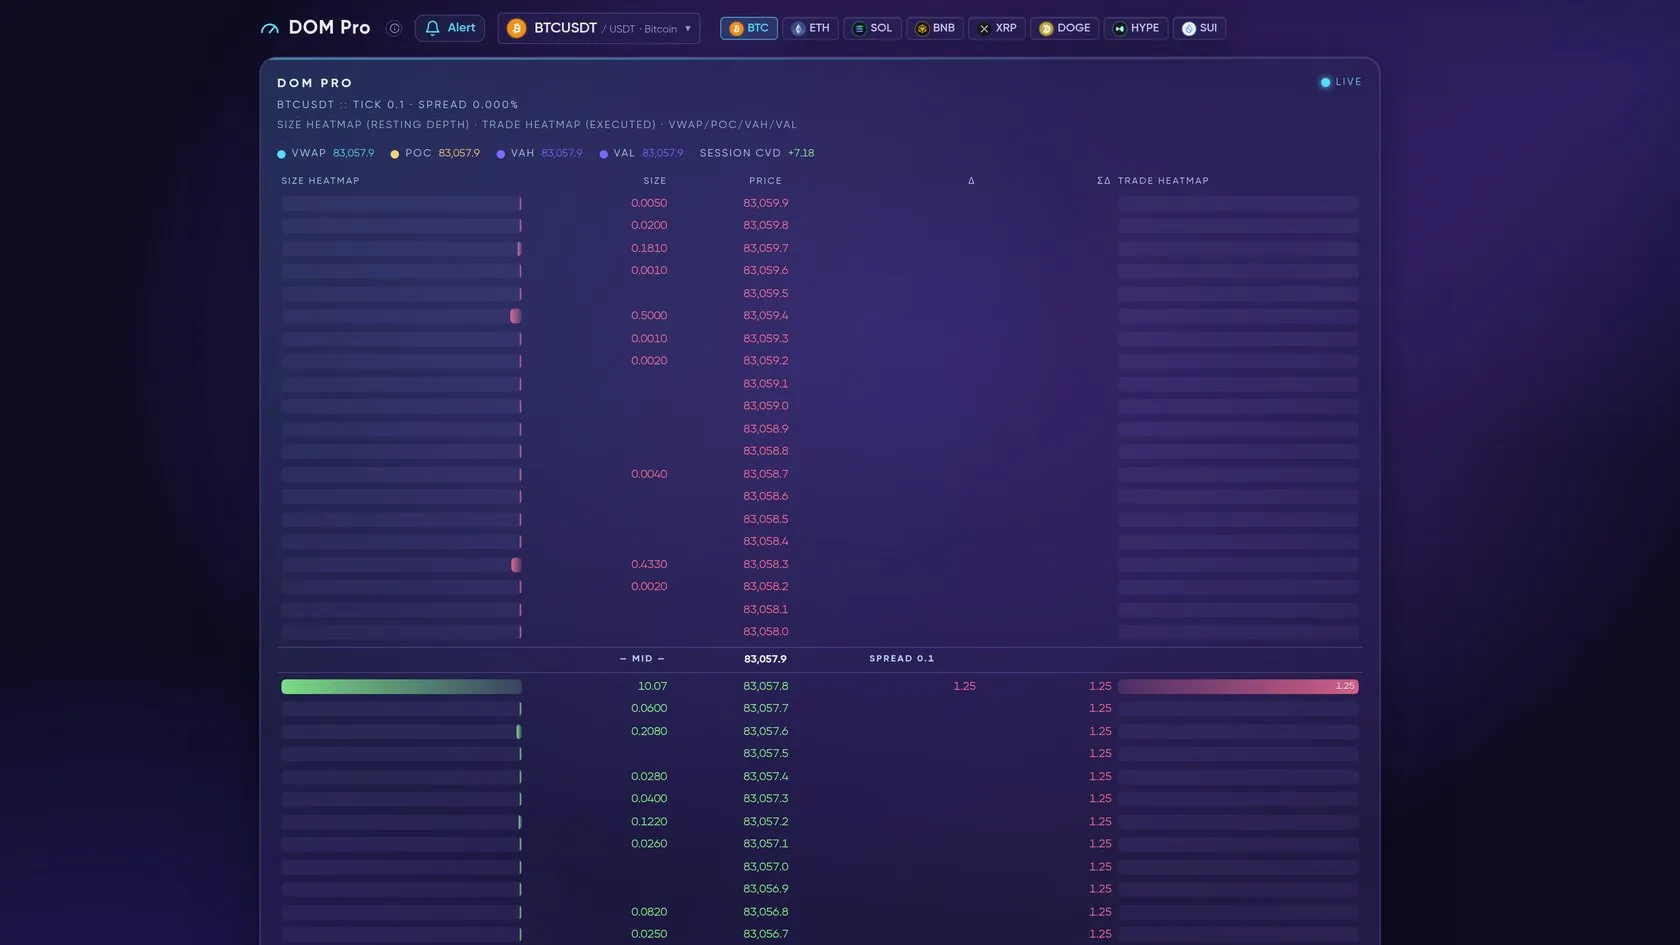
DOM Pro — depth-of-market ladder with size and trade heatmaps.
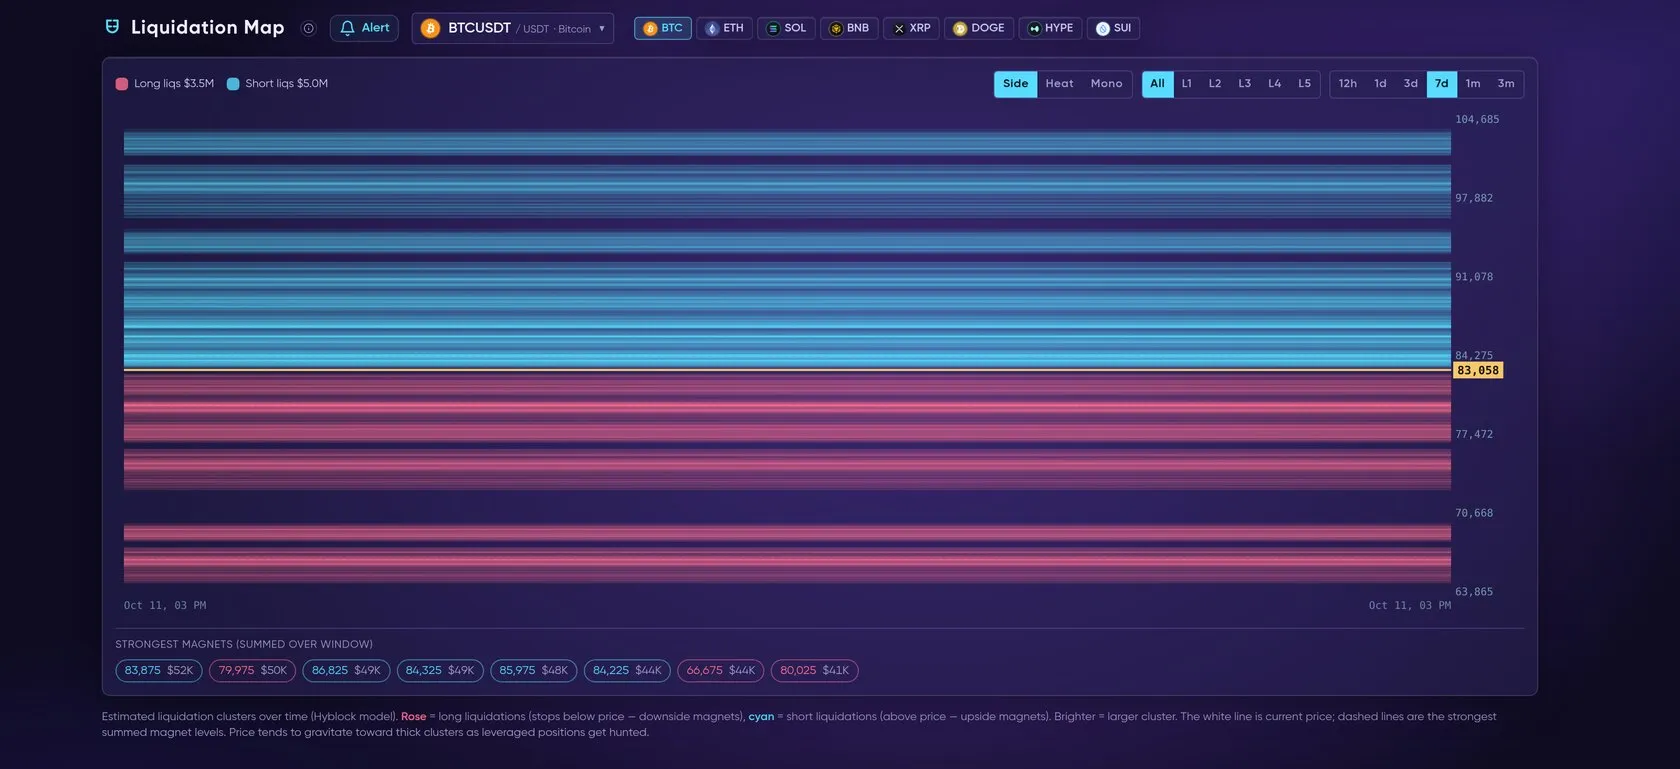
Liquidation Map — clustered liquidation levels over time.
Relative size filter and BLOCK prints
Section titled “Relative size filter and BLOCK prints”On the Order Flow page (/orderflow) the tape has two size filters that work together:
- USD minimum — the slider you already know: only prints of at least this many dollars.
- × avg — Off (default), ×2, ×5 or ×10: only prints (and liquidations) at least that many times the average print of this symbol.
The average is a rolling average of the last 2,000 prints of the symbol, across every venue you have switched on (liquidations are not counted in it), refreshed 5 times a second. The relative filter starts working after the first 200 prints, and the control shows the current average next to the buttons (for example avg $1.7K). Because the average moves with the market, ×5 means “big for  BTC right now” on BTC and “big for this coin right now” on a small coin — the same setting works on any symbol.
- BLOCK — a print of ×10 or more the average gets an amber BLOCK tag in Significant Trades. Hover any print to see its multiple (for example
×12.4 the average print · block print). - Title — when the filter is on, the Significant Trades title shows it, for example
Significant Trades ≥ $50K · ≥ ×5 avg. - Venue logos — every row in Significant Trades carries the real logo of the venue the print came from (for example Binance, Bybit, OKX, Coinbase,
 MEXC, Hyperliquid,
 Asterdex).
×5 keeps only prints at least 5× the average print of this symbol; a print of ×10 or more gets a BLOCK tag; the average follows each coin. Sample values (DEMO).

The × avg control: Off, ×2, ×5 or ×10 the average print of this symbol; next to it, the current average (here $1.7K).
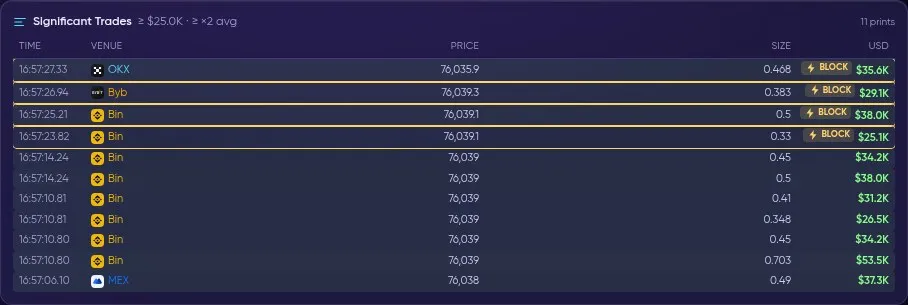
Significant Trades with the ×N filter on: venue logo per print and the BLOCK tag on prints of ×10 or more.
Liquidation Map
Section titled “Liquidation Map”The Liquidation Map (Data Hub → Liquidation Map, /liquidation-map) is a model estimate: from open interest and positions opened over the chosen window it estimates where leveraged positions would be force-closed. The source is Binance USDⓈ-M (optionally Bybit coin-margined). Sizes are relative strength, not dollars. Heatmap shows the levels over time with candles, Map shows them by price and leverage group.
- Full screen: the Full screen button above the chart (or the F key) opens the whole panel — chart with its price axis, the lower pane, the legend and Appearance — on the whole screen; Esc, F or the button closes it. On iPhone it fills the browser window.
- What it is NOT: these are not orders in the book and not a forecast — they only show where forced orders could appear if price gets there.
Liquidity Map vs Liquidation Map
Section titled “Liquidity Map vs Liquidation Map”| Liquidity Map | Liquidation Map | |
|---|---|---|
| What it is | Real resting limit orders that Formion records from 11 venues | A model estimate of where leveraged positions would be force-closed |
| What you see | Where orders sit now and where they sat before, in real USD | Where forced orders could appear — relative strength, not dollars |
| Source | Order books of 11 markets (Binance, Bybit, OKX,  Bitget perp + spot, Coinbase, Hyperliquid, Deribit) |
Binance USDⓈ-M (optionally Bybit coin-margined) |
| Can it change? | Yes — any order can be pulled at any moment | Yes — the estimate moves as positions open and close |
The Liquidity Map also shows real Hyperliquid liquidation levels — actual liquidation prices of open positions, but only of the Hyperliquid accounts we track.
Live recording: Chart Pro → Constructor — chart + volume profile, tape feed and liquidations side by side, then the Heatmap Focus preset.
HL Trade Intent (Hyperliquid)
Section titled “HL Trade Intent (Hyperliquid)”HL Trade Intent is a pane under the chart in Chart Pro. For every bar it shows the USD value of new longs opened (bars up) and new shorts opened (bars down) on Hyperliquid. The Closes button adds the longs and shorts that were closed in the same bar.

HL Trade Intent under a BTC chart: new longs opened (up) and new shorts opened (down) per bar. The title sums the visible range.
- Title:
New long $X · New short $Y— the totals for the range you can see on the chart. - Hover a bar: the time, all four numbers (new long, new short, short closes, long closes), liquidation closes and how confident the bar is.
- Turn it on: HL tab → Show trade intent, or in the Order Flow Suite settings. The ✕ in the pane hides it again.

Closes switched on and one bar hovered: new long, new short, short closes, long closes and the confidence of that bar.
How it is measured
Section titled “How it is measured”Every Hyperliquid trade carries the buyer’s and the seller’s address. Each side is classified from that address’s position before the trade:
| Position before the trade | A buy is… | A sell is… |
|---|---|---|
| Flat | a new long | a new short |
| Long | adding to the long (new long) | closing the long — anything larger flips: the rest is a new short |
| Short | closing the short — anything larger flips: the rest is a new long | adding to the short (new short) |
Positions start from a daily snapshot of all Hyperliquid positions and are rolled forward through the live trade tape.
One trade, two addresses: the buyer was short, so part of the buy closes the short and the rest is a new long; the seller was flat, so the whole sell is a new short. The pane adds it up per bar. Sample values (DEMO).
Accuracy and confidence
Section titled “Accuracy and confidence”| Bar label | What it means |
|---|---|
| Exact (Hyperliquid fill labels) |
Hyperliquid’s own direction label for every fill. Hyperliquid publishes a day about 1.5 days later; that day then replaces our live numbers. Liquidation amounts are shown only on these days |
| Live estimate, lower confidence | The last ~1–2 days, classified by Formion from the live tape. Measured at about 97–99 % agreement with Hyperliquid’s later labels |
We checked the classification against Hyperliquid’s own per-fill direction labels: 98.0–99.8 % agreement by notional on 3 full days (3–5 Nov 2026). The small rest comes mostly from trades that Hyperliquid’s public feed does not deliver during very large bursts, such as liquidation cascades.
- Coverage: Hyperliquid main perps only (the pane says HL main perps). HIP-3 markets are not included.
- Data, not a signal: HL Trade Intent shows who is opening and who is closing. It is not a buy or sell signal and says nothing about where price goes next.
Why it matters
Section titled “Why it matters”Absorption, a resting wall and a liquidation cluster — the three patterns these tools help you read.
Indicators lag; order flow is the cause, not the effect. Seeing absorption at a level, where large resting orders sit, or where liquidations cluster helps you read what the market is doing right now. Resting orders can be pulled at any time, so treat walls as context about the current book, not as a promise of support or resistance. Formion puts that read in one place.