


Chart Pro — Quantum Terminal
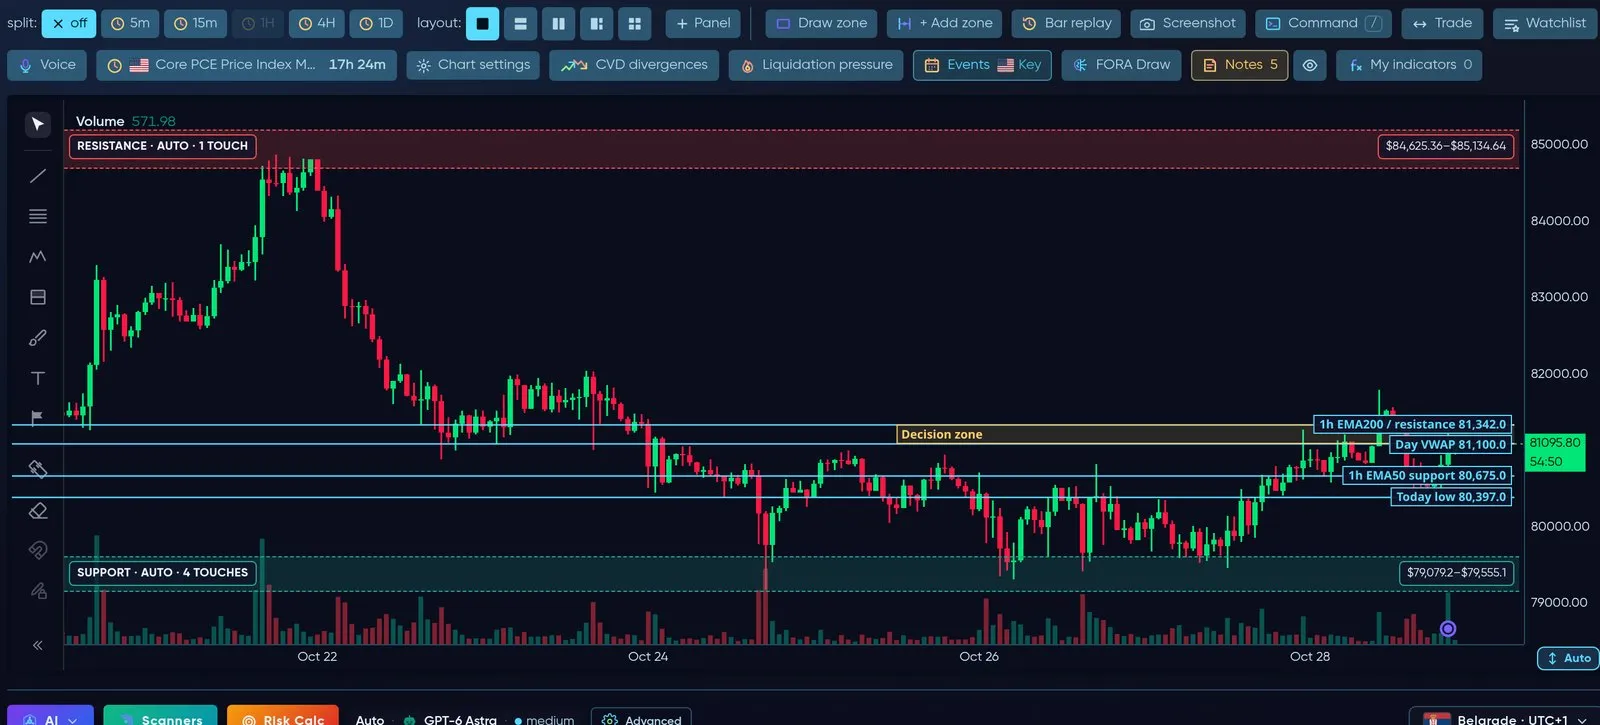
Quantum Terminal: chart tools on top, the chart, drawing tools on the left, live price on the right.
Chart Pro (app.formion.ai → Chart Pro, or straight to app.formion.ai/chart) is Formion’s trading chart. Inside it runs Quantum Terminal — our chart engine that picks the fastest way to draw what you have switched on, so the chart stays smooth while you trade.
Speed is the point. A chart that lags costs you entries. Quantum Terminal is measured every week and tuned so that turning on more studies does not slow the candles down.
Draw your own zone, ask FORA to set an alert, then trade from the chart: limit at your price, size in USD, drag SL/TP and confirm the full plan before anything is sent.
Live recording: Command line to ETH 4h, VWAP, Levels and FVG on, a trend line drawn, then the Volume Delta pane from Order Flow.
How Quantum Terminal works — Swift and Velocity
Section titled “How Quantum Terminal works — Swift and Velocity”Quantum Terminal has two drawing engines under one name. You never have to choose — it switches for you.
| Swift | Velocity | |
|---|---|---|
| What it is | The light, very fast engine | The full engine with every study |
| Best for | Fast trading, phones, standard indicators | Advanced order-flow and positioning studies, split panels |
| Draws | Candles, volume, EMA, Bollinger Bands, VWAP, RSI, MACD and the other standard indicators, Levels, Liquidity Heat & Magnets, Whales, Sessions, S/R Zones, FVG / IFVG, Order Blocks, Breakers, Mitigation Blocks, BoS/CHoCH, Fibonacci, D/P Zones, Volume & Delta Profile, Order Book, DOM, Footprint, Heatmap, Tape | Everything Swift draws plus AVWAP, Big Trades, Bubbles, Weekend Gaps, CVD, Divergences, Funding, Ichimoku, Bid/Ask imbalance, Liquidations, Long/Short ratio, Net Delta, Open Interest, Patterns, Trades, Whale vs Retail, split panels |
| Phones | Always used on phones | Desktop only |
Quantum mode (default): the chart starts on Swift. The moment you switch on a study only Velocity can draw — for example CVD or Open Interest — or open split panels, Quantum Terminal moves to Velocity by itself, and back again when you turn it off. Symbol, timeframe and drawings stay where they are.
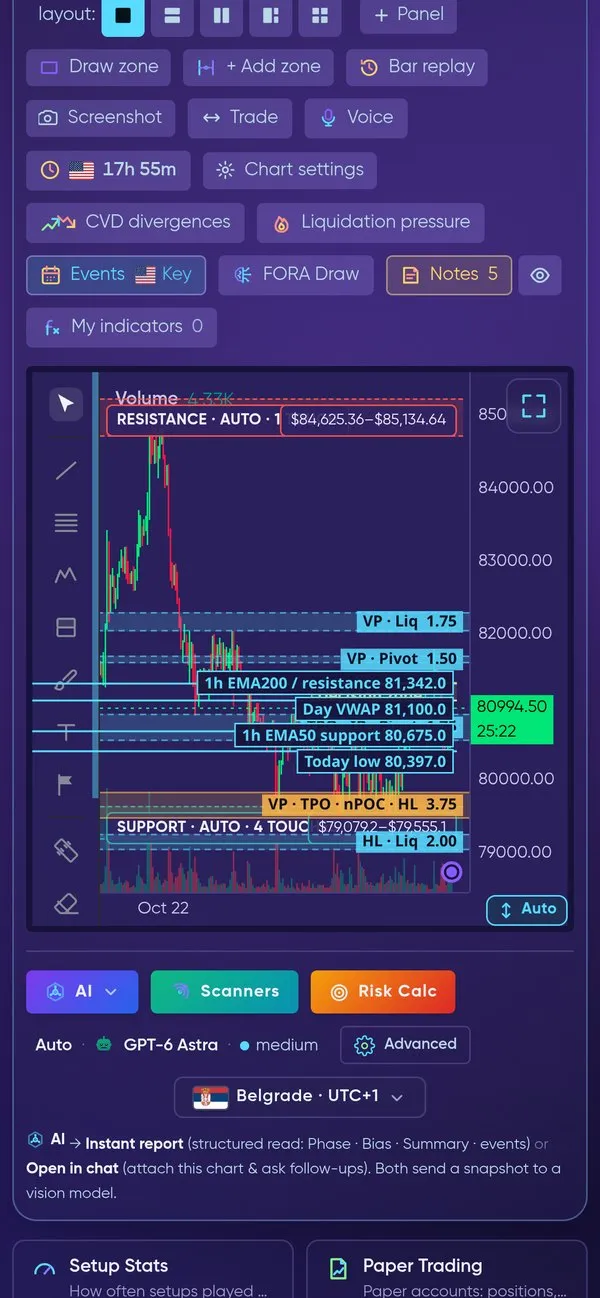
The same chart on a phone — Swift, with the chart tools above it and AI, Scanners and Risk Calc below.
Indicators on the chart
Section titled “Indicators on the chart”The chart opens clean — no indicators until you switch them on in the indicator grid above the chart. A highlighted chip is on; your choice is remembered for next time. Here is what the most used ones look like on a real BTCUSDT 1h chart.
Volume, EMA 200 and VWAP
Section titled “Volume, EMA 200 and VWAP”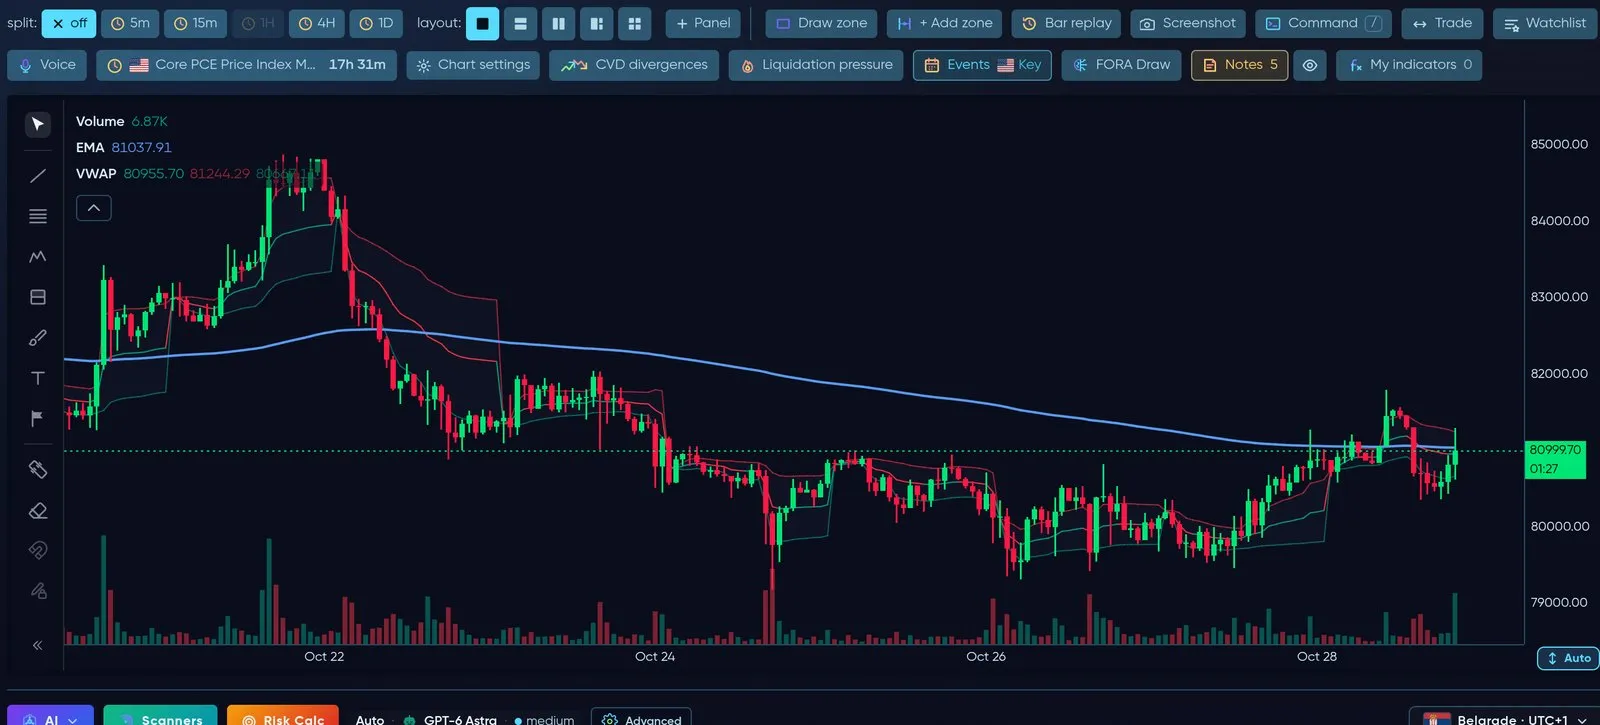
Volume bars, the 200 EMA trend line and VWAP with its bands.
Session VWAP ±σ bands
Section titled “Session VWAP ±σ bands”Open the VWAP settings → Session σ bands → Show ±σ bands on the session VWAP (off by default). The chart then draws a volume-weighted standard-deviation envelope around the session VWAP: ±1σ only, or ±1σ + ±2σ (Band count). The bands reset together with the VWAP at every session start and use the same math as the Anchored VWAP bands. On Velocity you can pick the Band colour; on Swift the bands use the VWAP indicator’s own band colours.
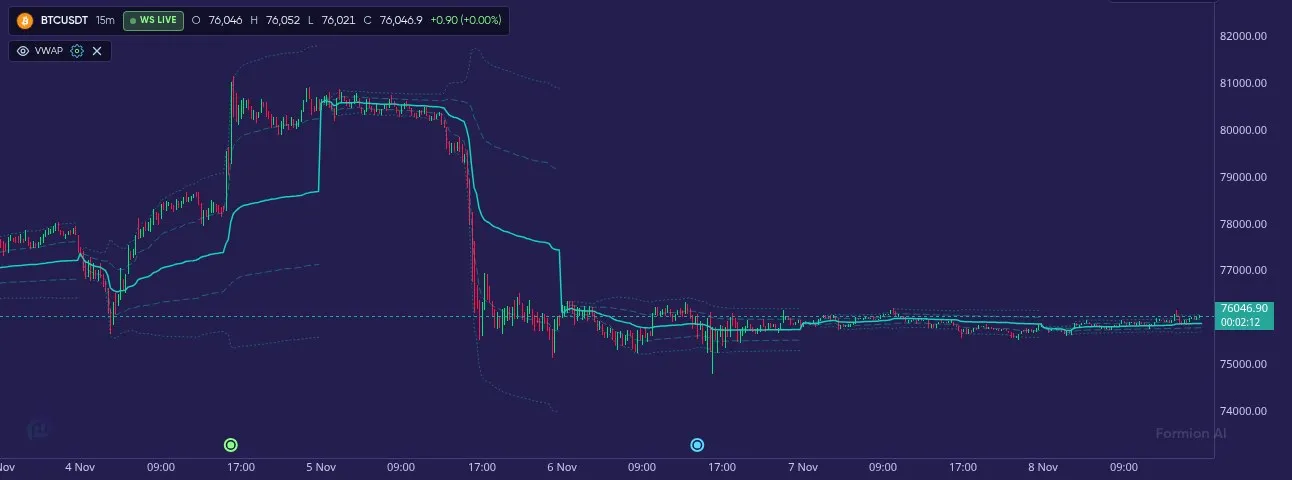
Session VWAP with its ±1σ and ±2σ bands — how far price is stretched from the session's average price.
The bands are context data: they show how far price has moved from the session’s volume-weighted average, not a buy or sell level.
Bollinger Bands
Section titled “Bollinger Bands”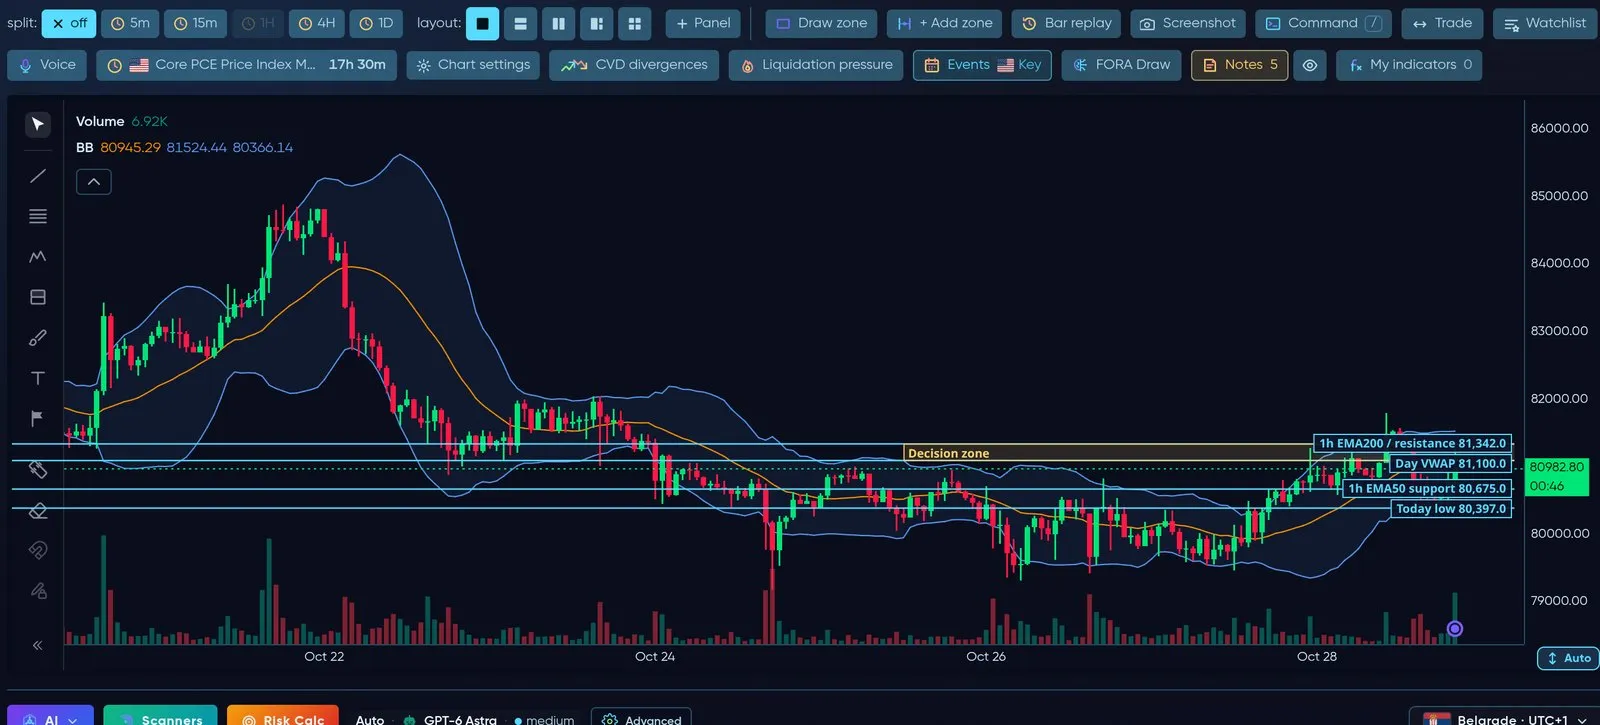
Bollinger Bands — volatility envelope around the 20-period average.
Pivot levels
Section titled “Pivot levels”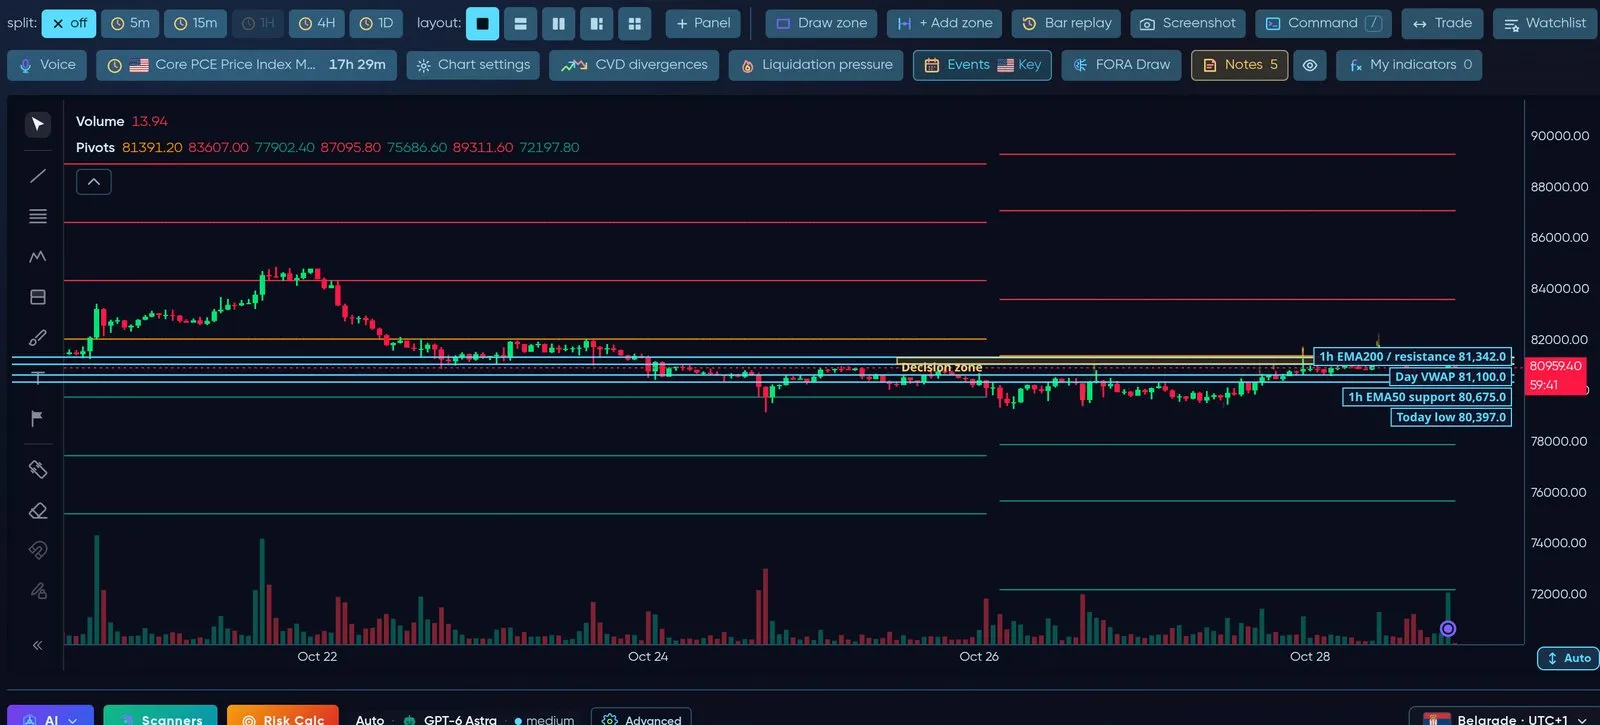
Automatic pivot levels — resistance above (red), support below (green).
Liquidity Magnets and Whales
Section titled “Liquidity Magnets and Whales”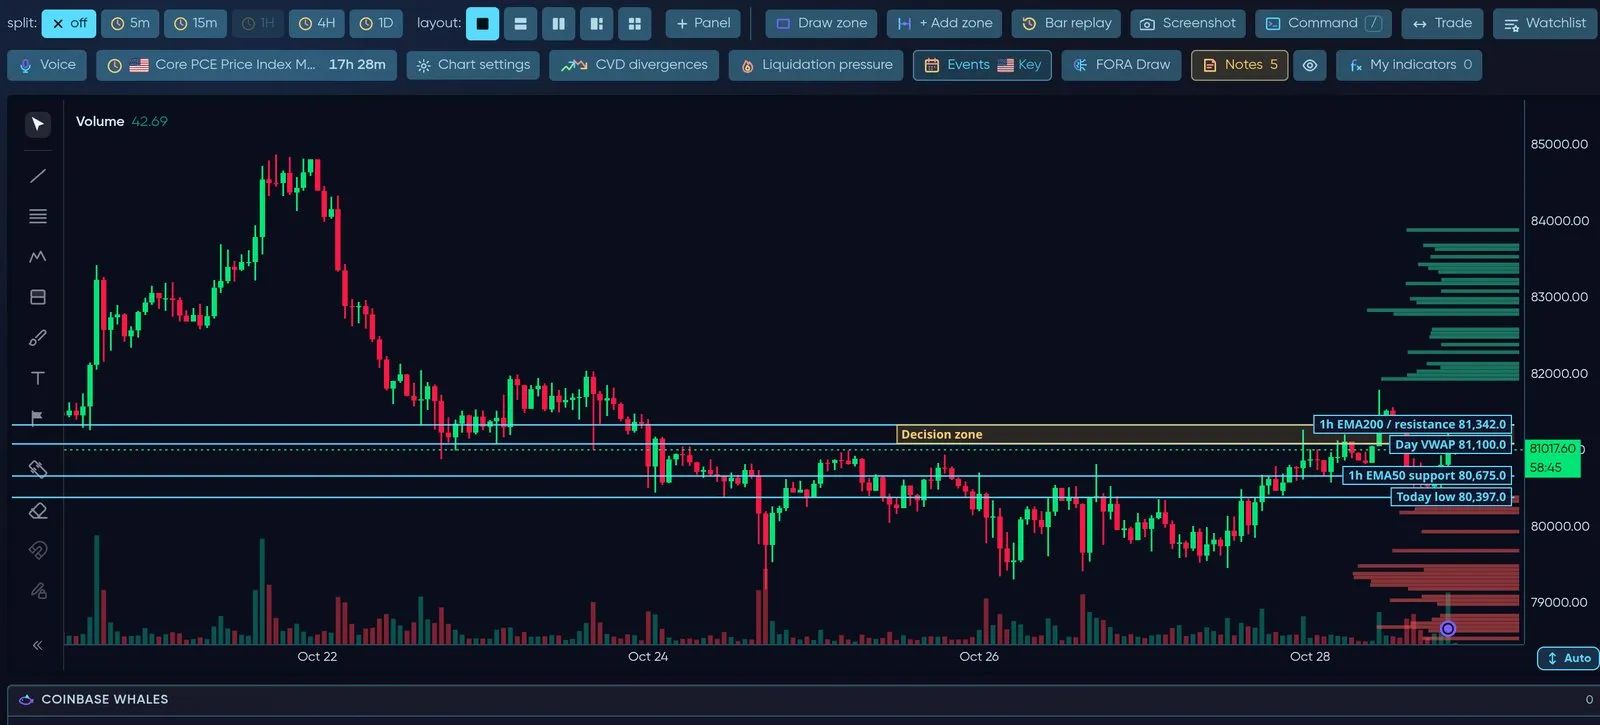
Liquidity Magnets on the right edge show resting liquidity that tends to pull price; Whales marks large orders.
Smart-money concepts — FVG, Order Blocks, Breakers
Section titled “Smart-money concepts — FVG, Order Blocks, Breakers”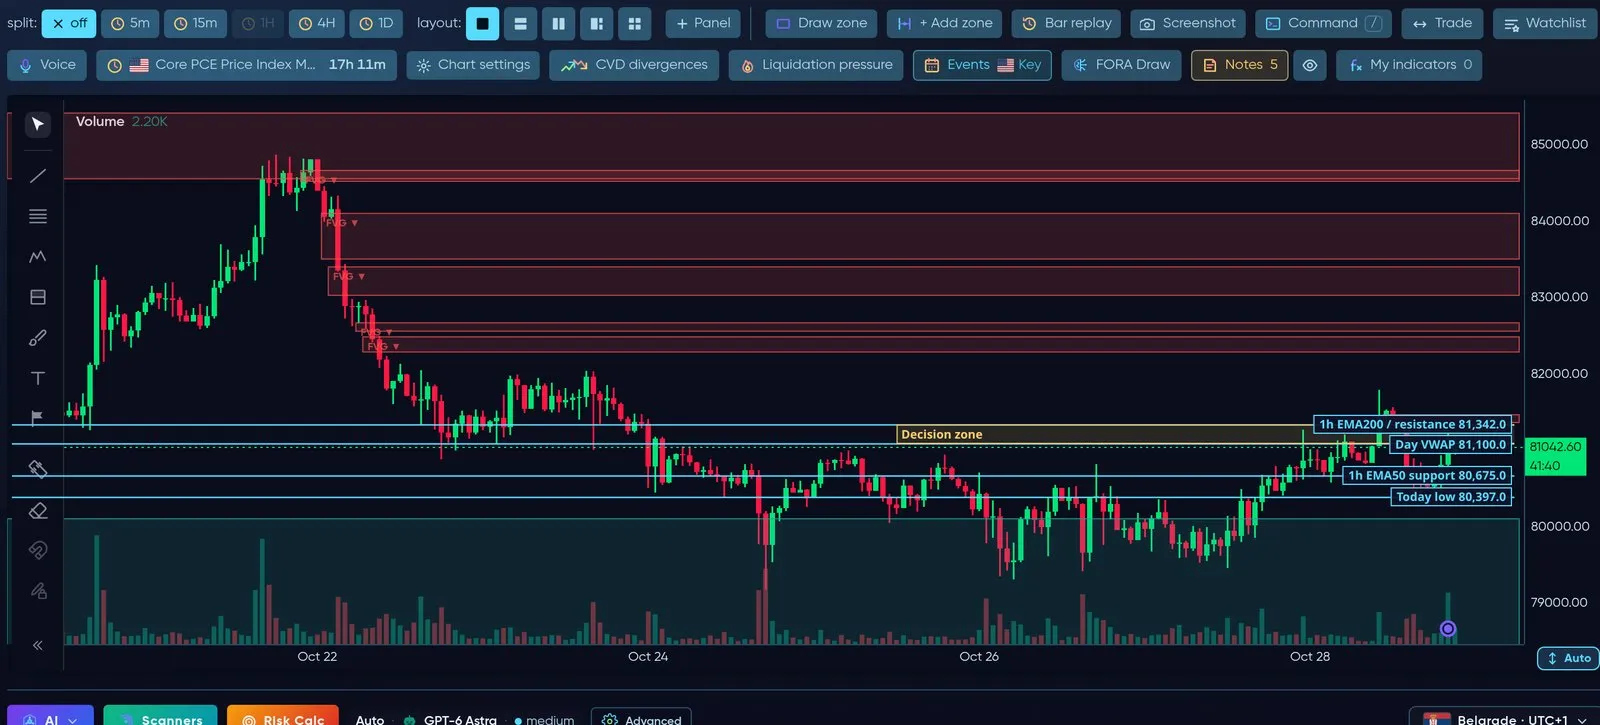
FVG — fair value gaps (price imbalances) still open, bearish in red, bullish in green.
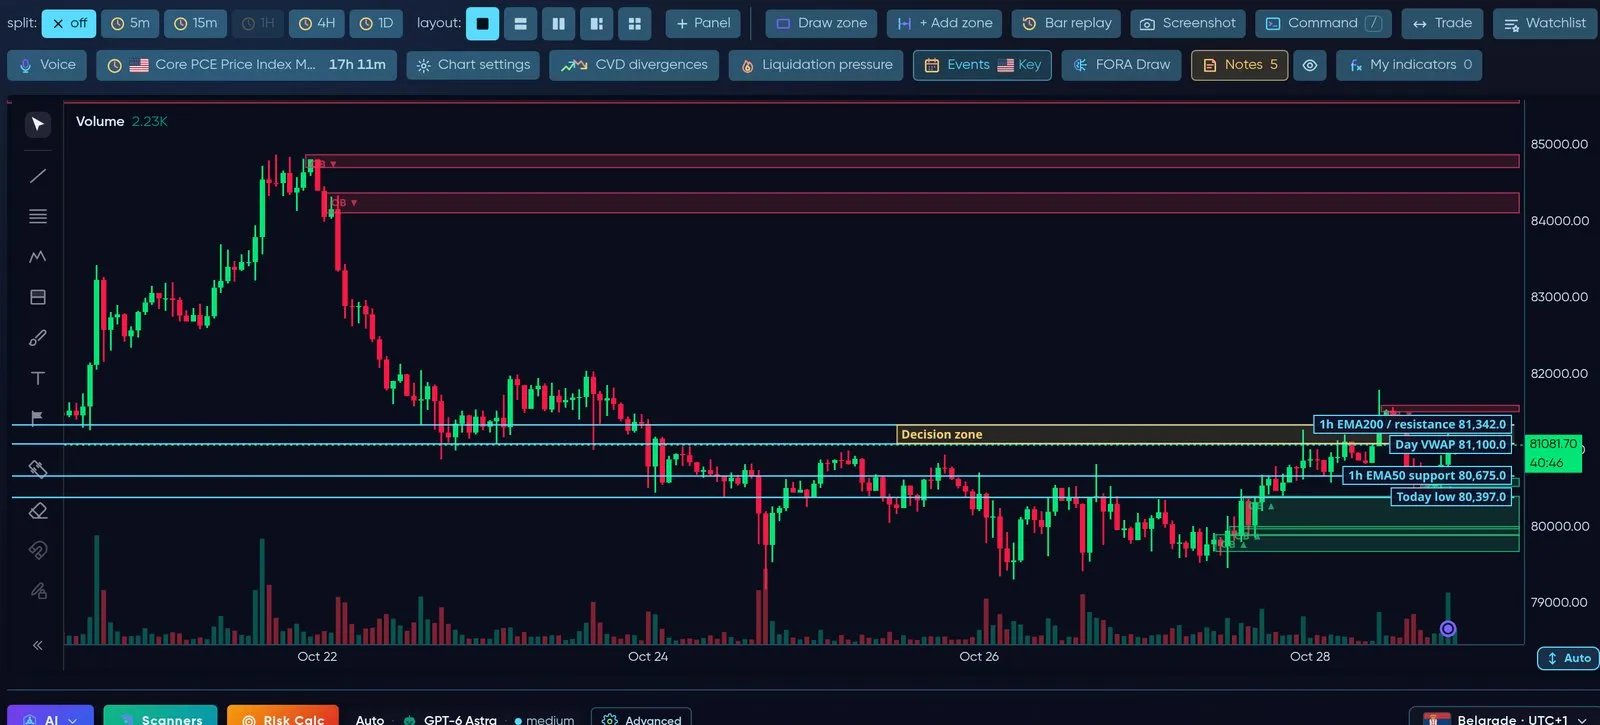
OB — order blocks: the last opposite candle before a strong move.
Market structure — BoS / CHoCH and Swings
Section titled “Market structure — BoS / CHoCH and Swings”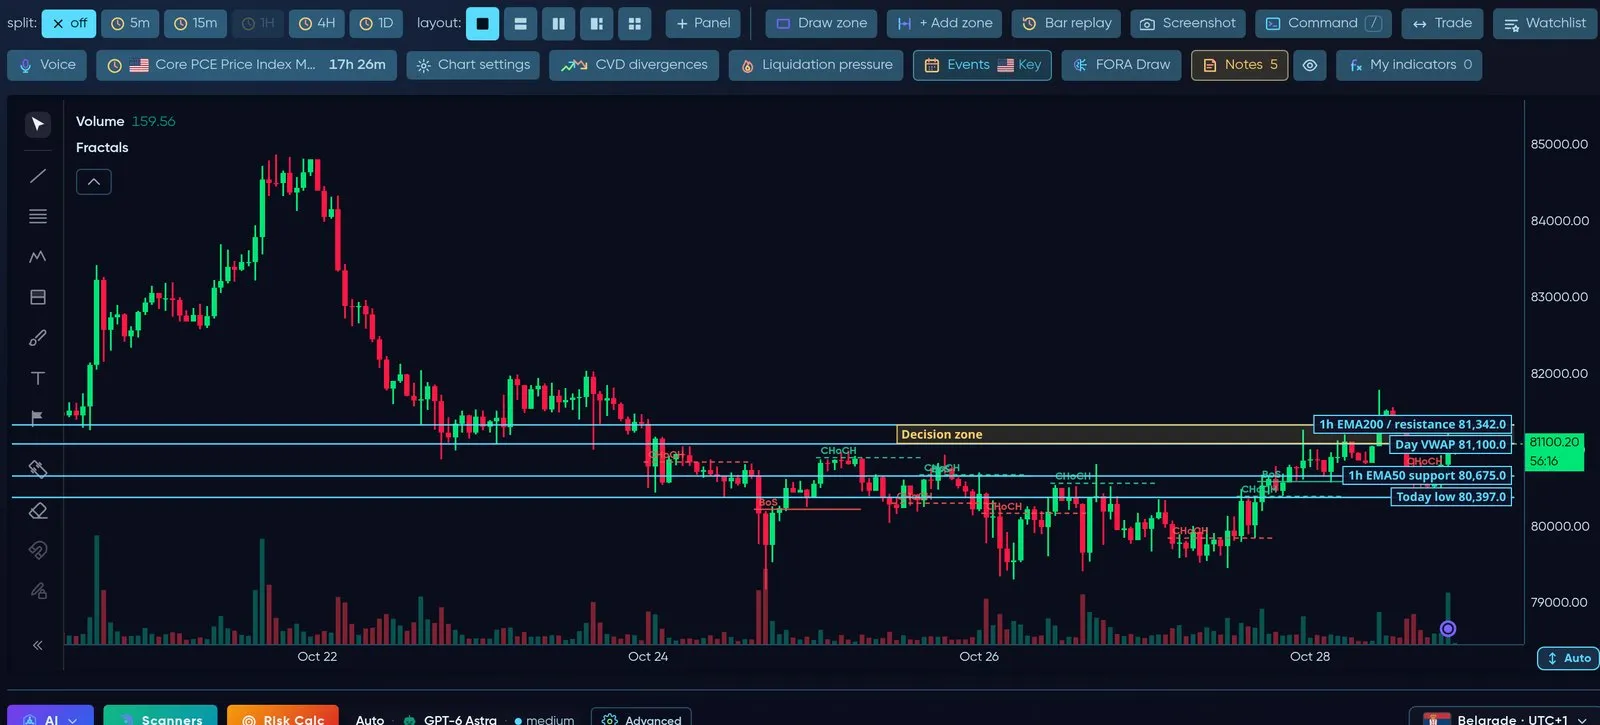
Break of Structure / Change of Character and swing highs and lows (fractals).
Fibonacci and Premium / Discount zones
Section titled “Fibonacci and Premium / Discount zones”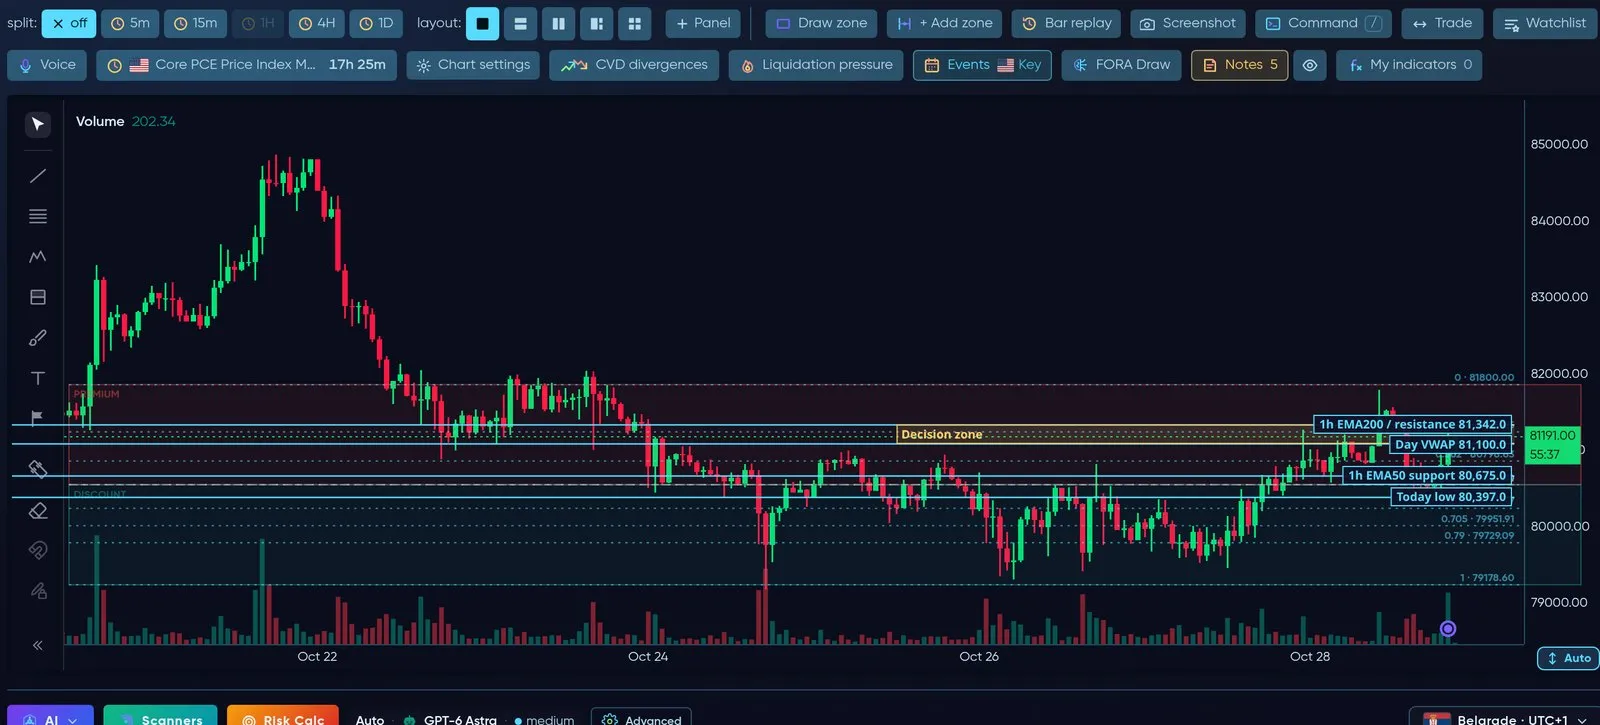
Automatic Fibonacci levels on the last swing, with premium (expensive) and discount (cheap) halves.
S/R Zones
Section titled “S/R Zones”Automatic support and resistance zones with the number of touches, plus your own zones (Draw zone / + Add zone). See the picture at the top of this page.
RSI and MACD
Section titled “RSI and MACD”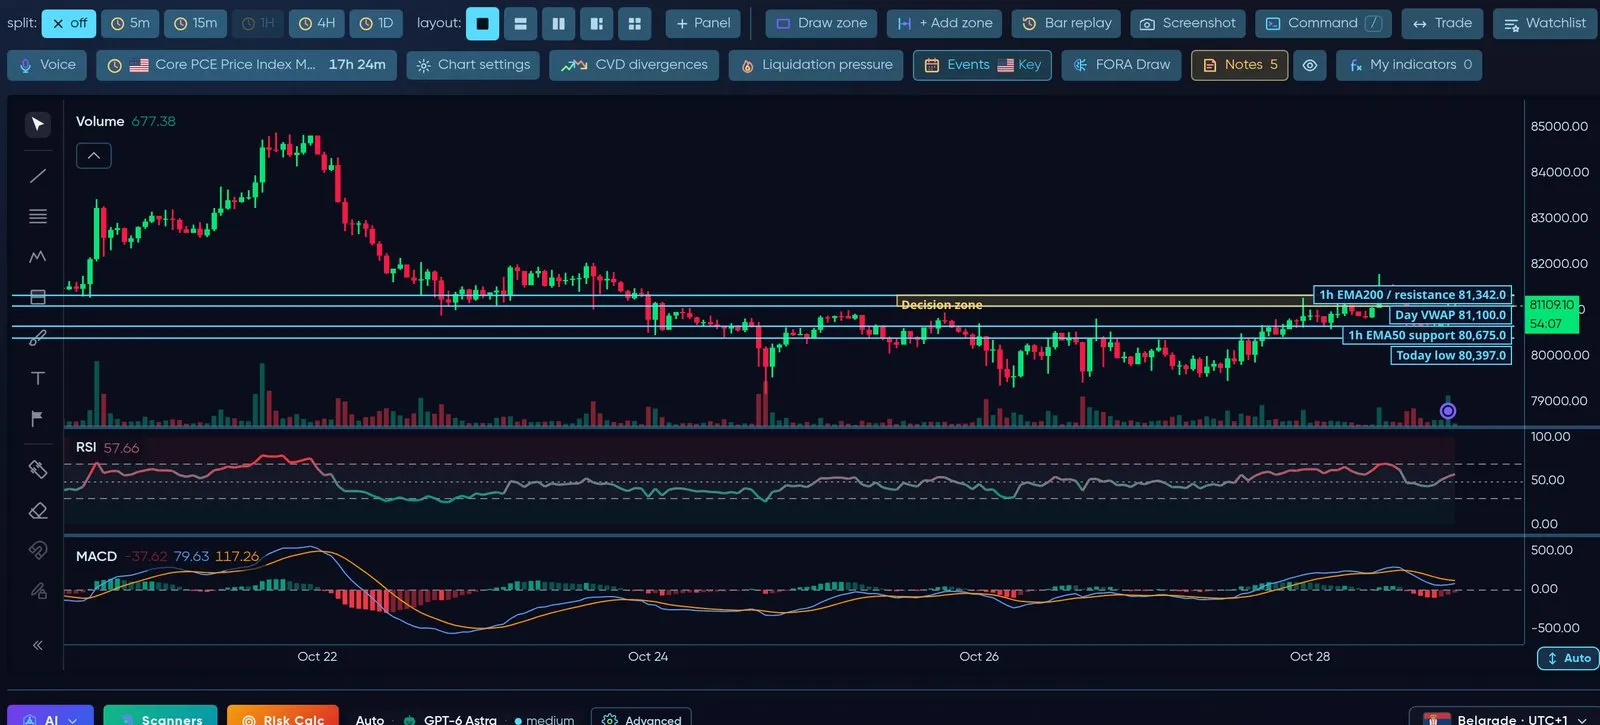
Oscillators open in their own panes under the price, time-aligned to the candles.
SuperTrend and Ichimoku
Section titled “SuperTrend and Ichimoku”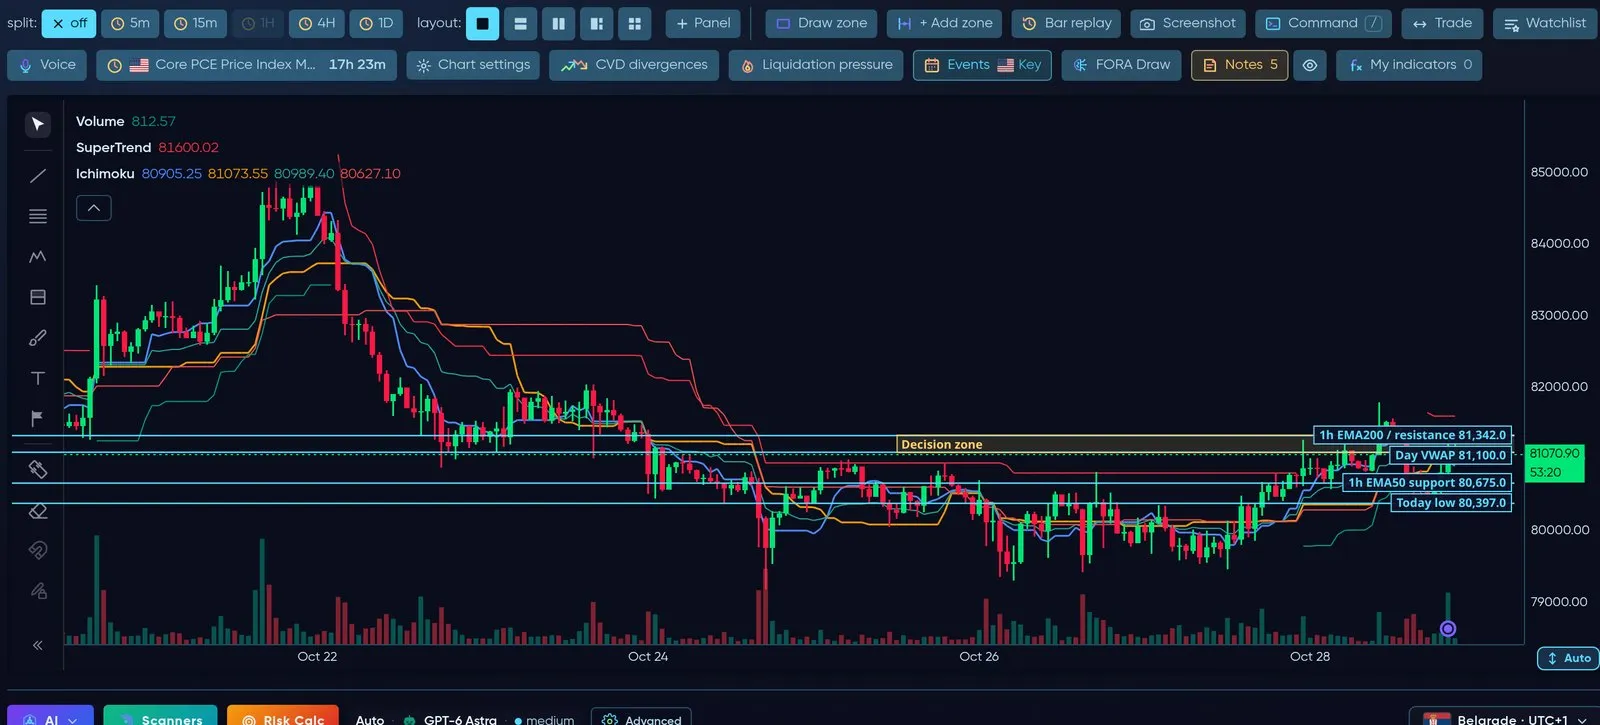
SuperTrend and the Ichimoku cloud for trend direction.
CVD, Open Interest and Funding (Velocity)
Section titled “CVD, Open Interest and Funding (Velocity)”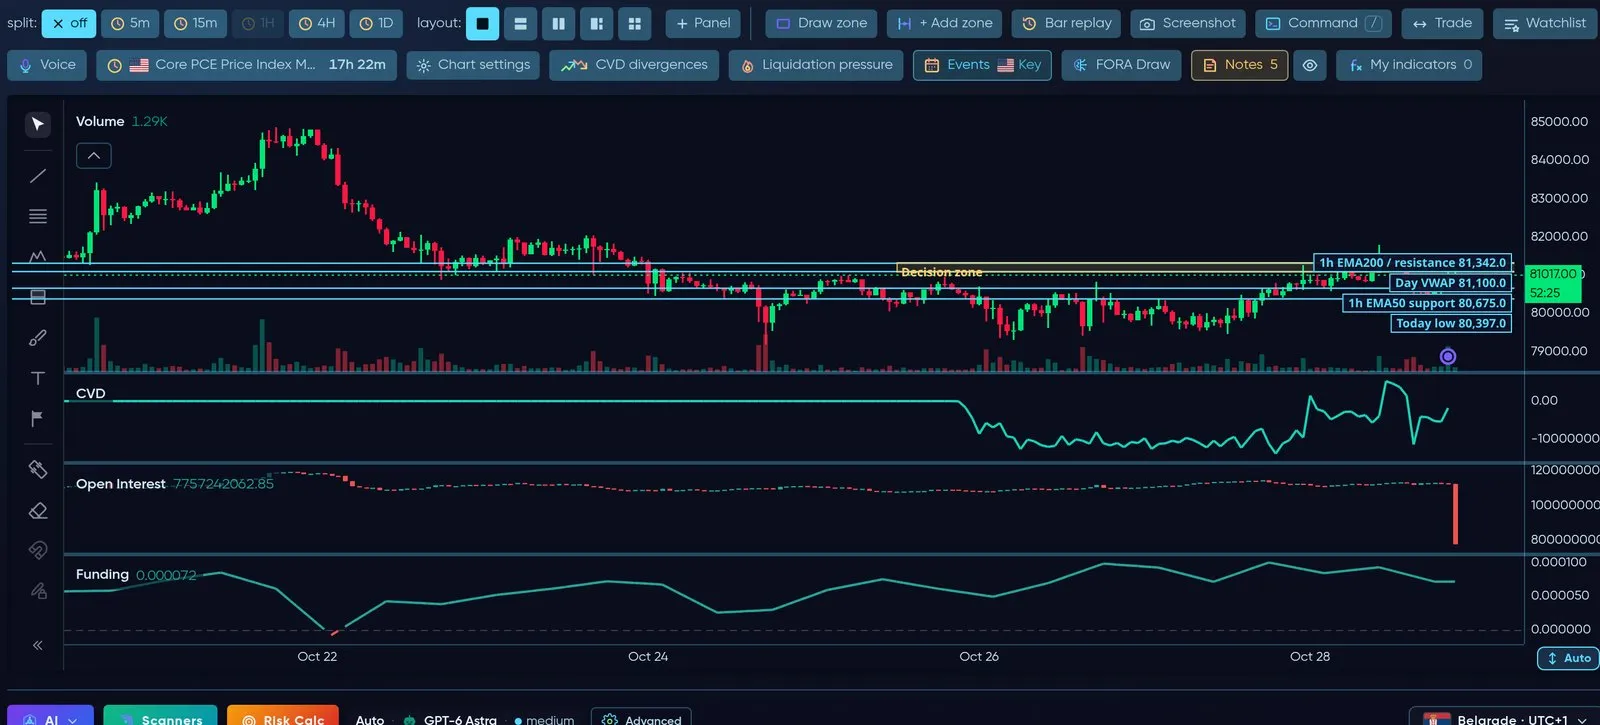
Cumulative volume delta, open interest and funding rate in panes under the chart — the positioning behind the move.
Long/Short ratio and Whale vs Retail (Velocity)
Section titled “Long/Short ratio and Whale vs Retail (Velocity)”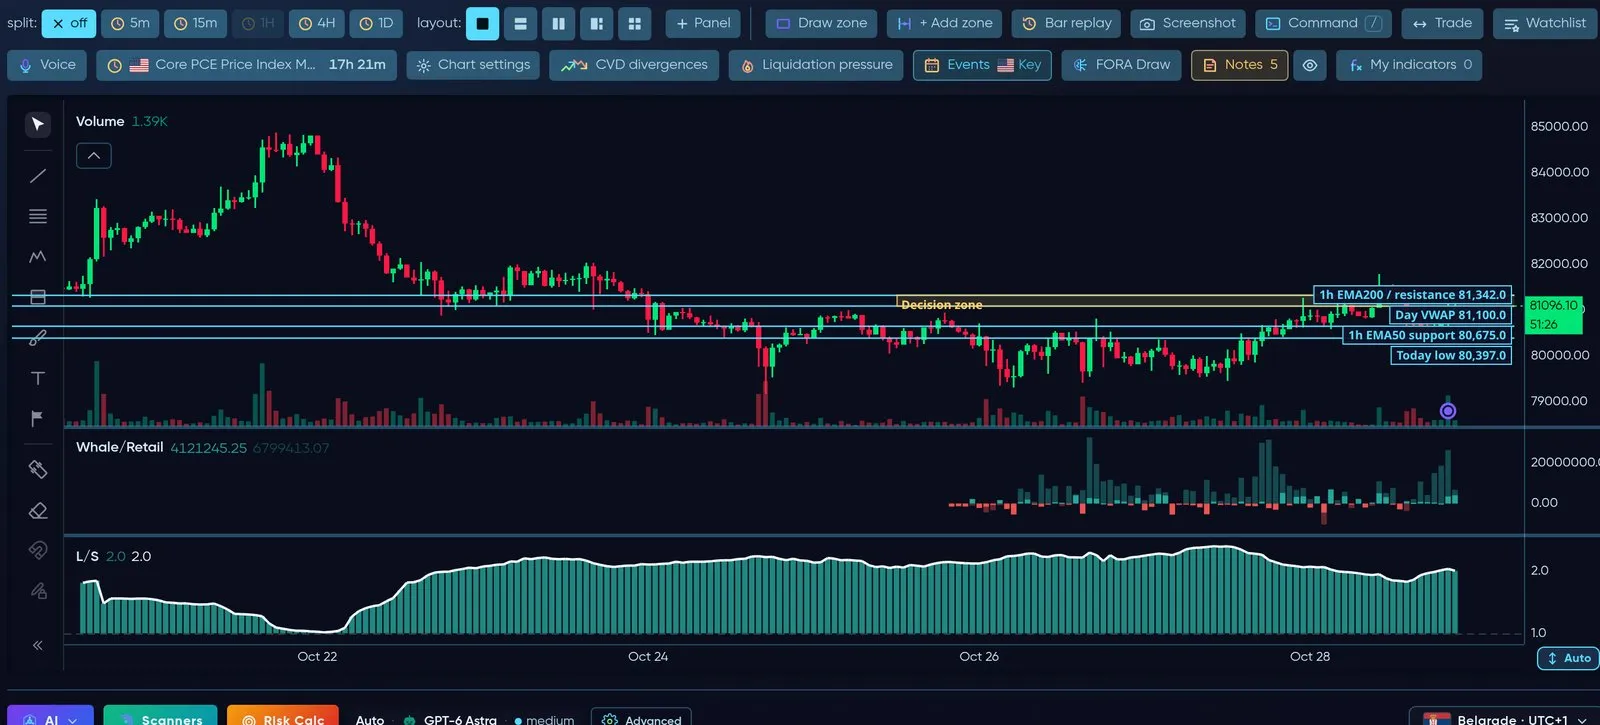
Who is positioned how: long/short ratio and large accounts versus small ones.
Big Trades and Bubbles (Velocity)
Section titled “Big Trades and Bubbles (Velocity)”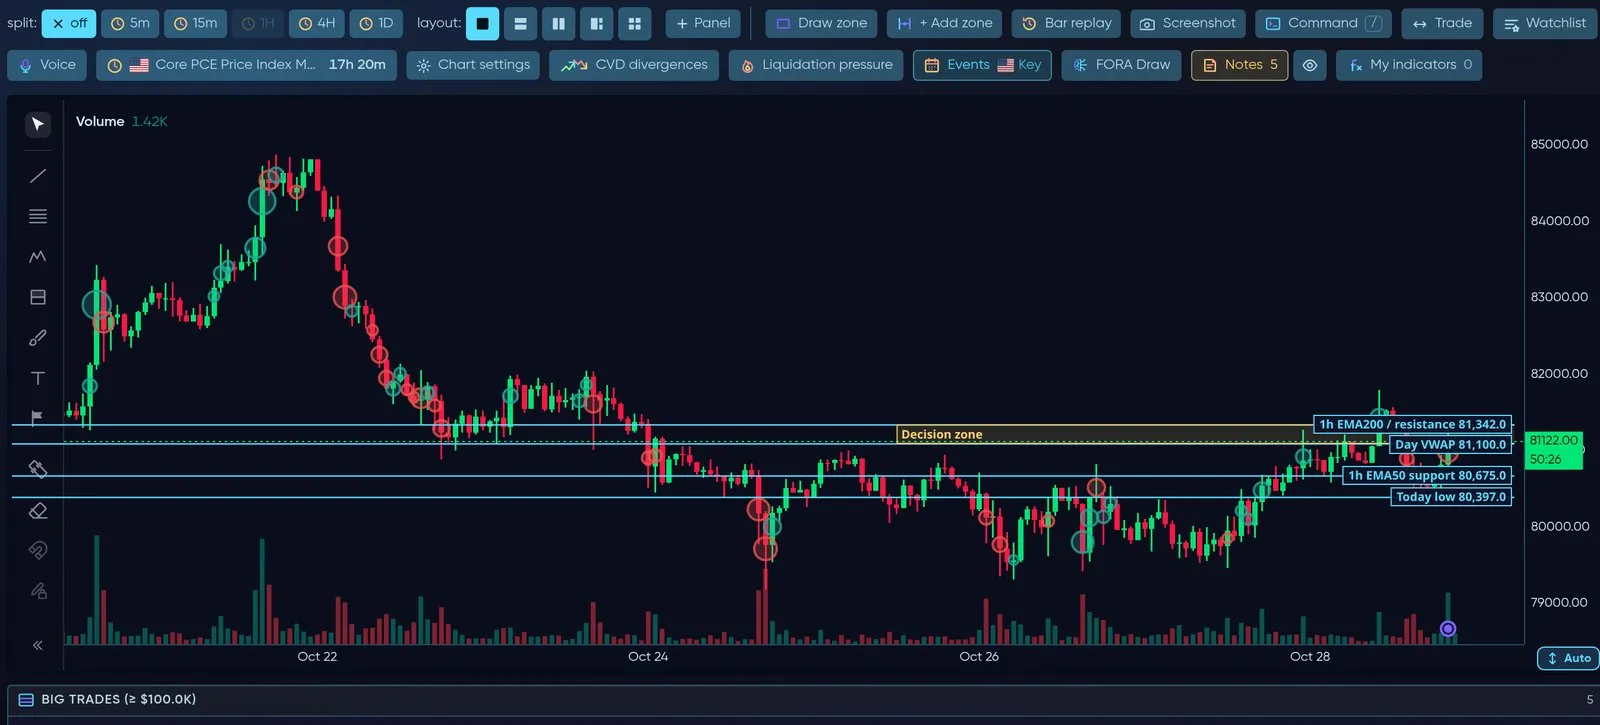
Large prints drawn as bubbles on the candles where they happened.
Patterns and Divergences (Velocity)
Section titled “Patterns and Divergences (Velocity)”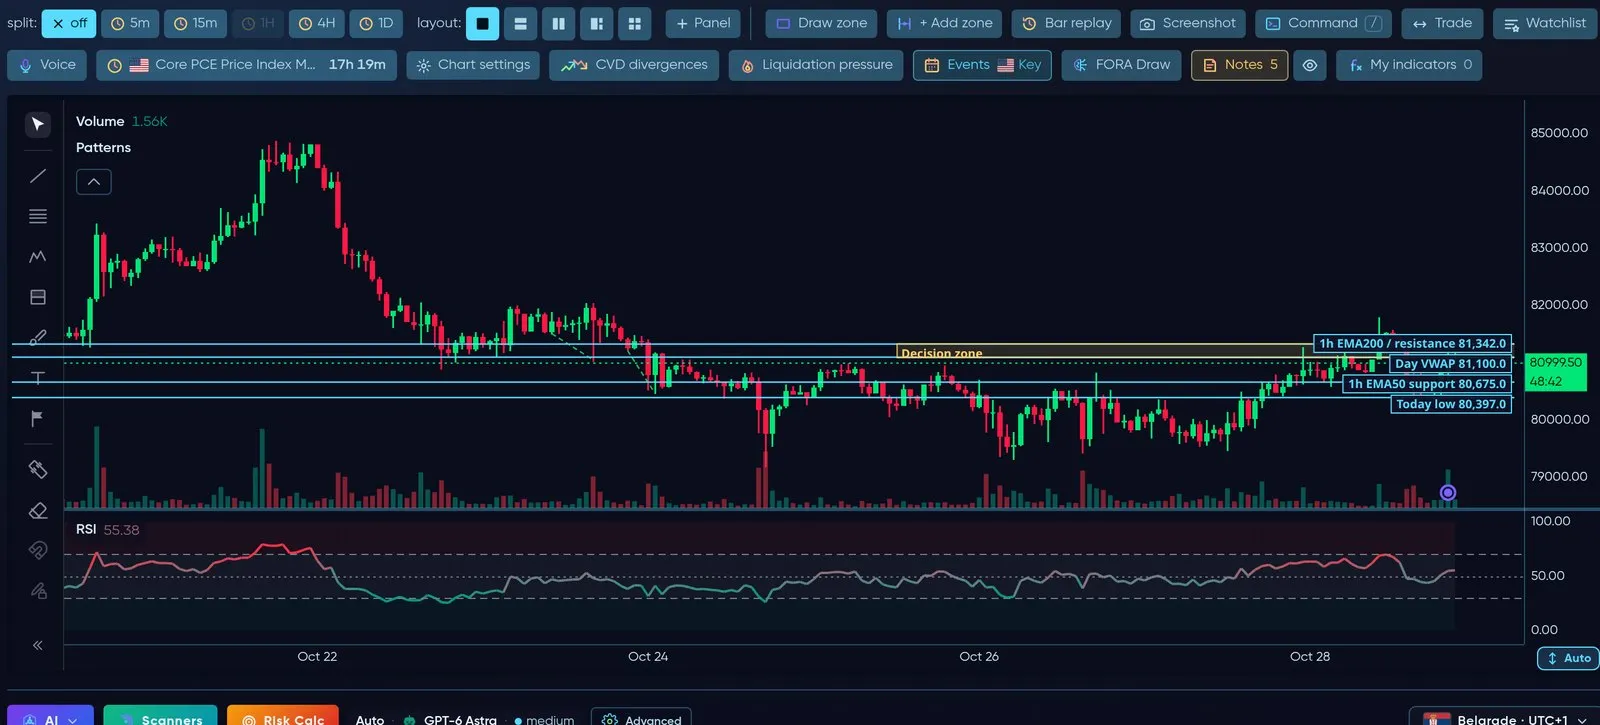
Candle patterns on price and divergences between price and RSI.
Anchored VWAP (Velocity)
Section titled “Anchored VWAP (Velocity)”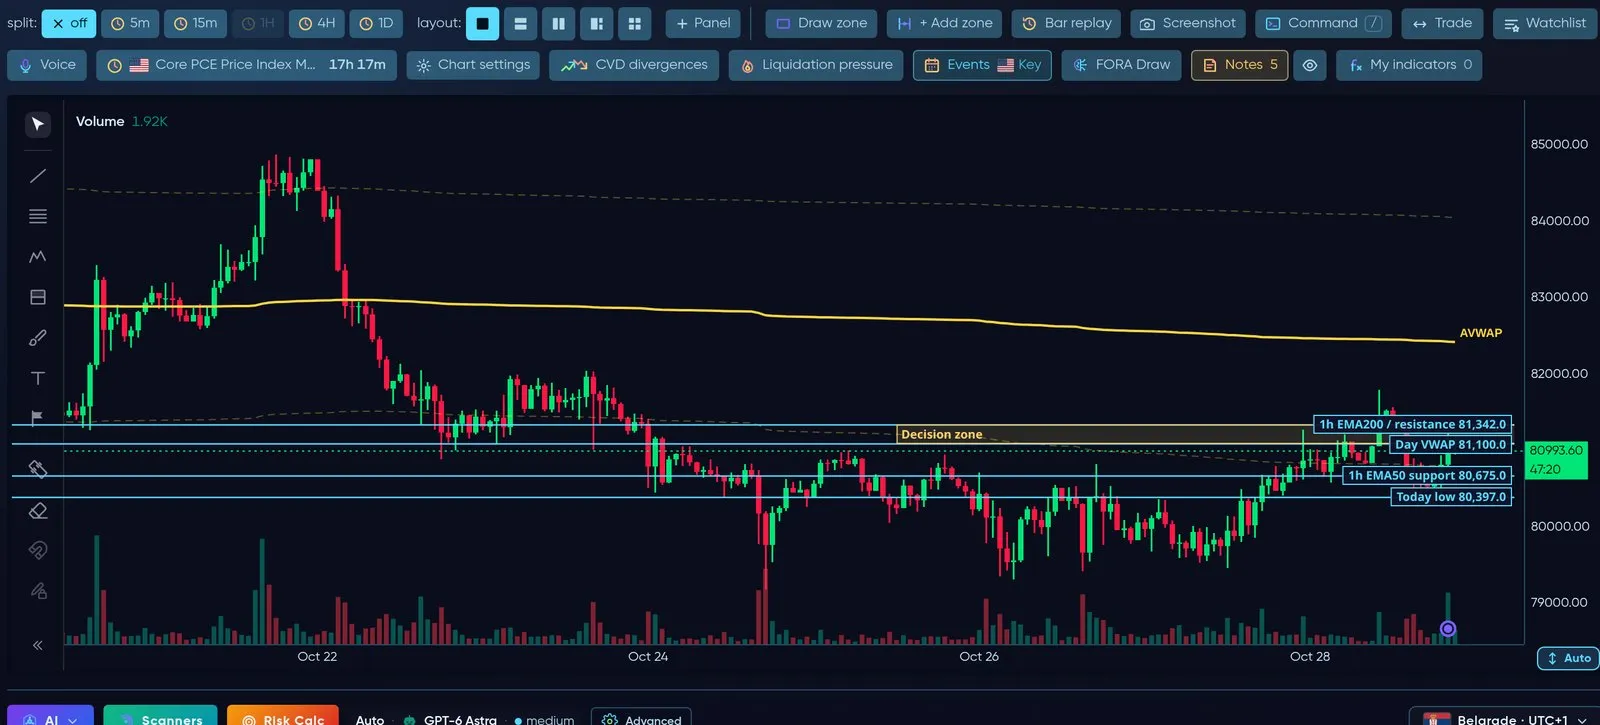
AVWAP anchored to a swing — the average price paid since that point.
More in the grid: Stoch RSI, Williams %R, ATR, ADX, IFVG, Mitigation Blocks, Geo levels, Weekend Gaps, Net Delta, Bid/Ask imbalance, Trades, Liquidations and the Order Flow Suite.
Chart tools
Section titled “Chart tools”Every extra layer has its own button in the tools row above the chart — never on top of the candles — and whatever you open appears above the chart.
| Button | What it does |
|---|---|
| split / layout | 1, 2 or 4 charts side by side, each with its own timeframe |
| Draw zone / + Add zone | Draw your own support/resistance zones |
| Bar replay | Step through history candle by candle |
| Screenshot | Save the chart as an image |
| Command (press /) | Type a symbol, timeframe or indicator and jump straight there |
| Trade | Opens the trade strip on the chart (see below) |
| Watchlist | Your symbols next to the chart |
| Voice | Talk to FORA about the chart you are looking at |
| Next event | Countdown to the next key US release |
| Chart settings | Candle colours, background, watermark, panels under the chart |
| CVD divergences | Marks where price and spot/perp CVD disagree |
| Liquidation pressure | Where leveraged positions would be forced out |
| Events | Key US economic releases on the time axis |
| FORA Draw | FORA marks levels and zones on your chart |
| Notes | Your own notes pinned to a price and time; the eye button shows or hides them |
| My indicators | Every indicator or strategy you saved — show or hide each one, or Hide all |
| OBI history | A pane with the order-book imbalance history of this market (see below) |
Split view
Section titled “Split view”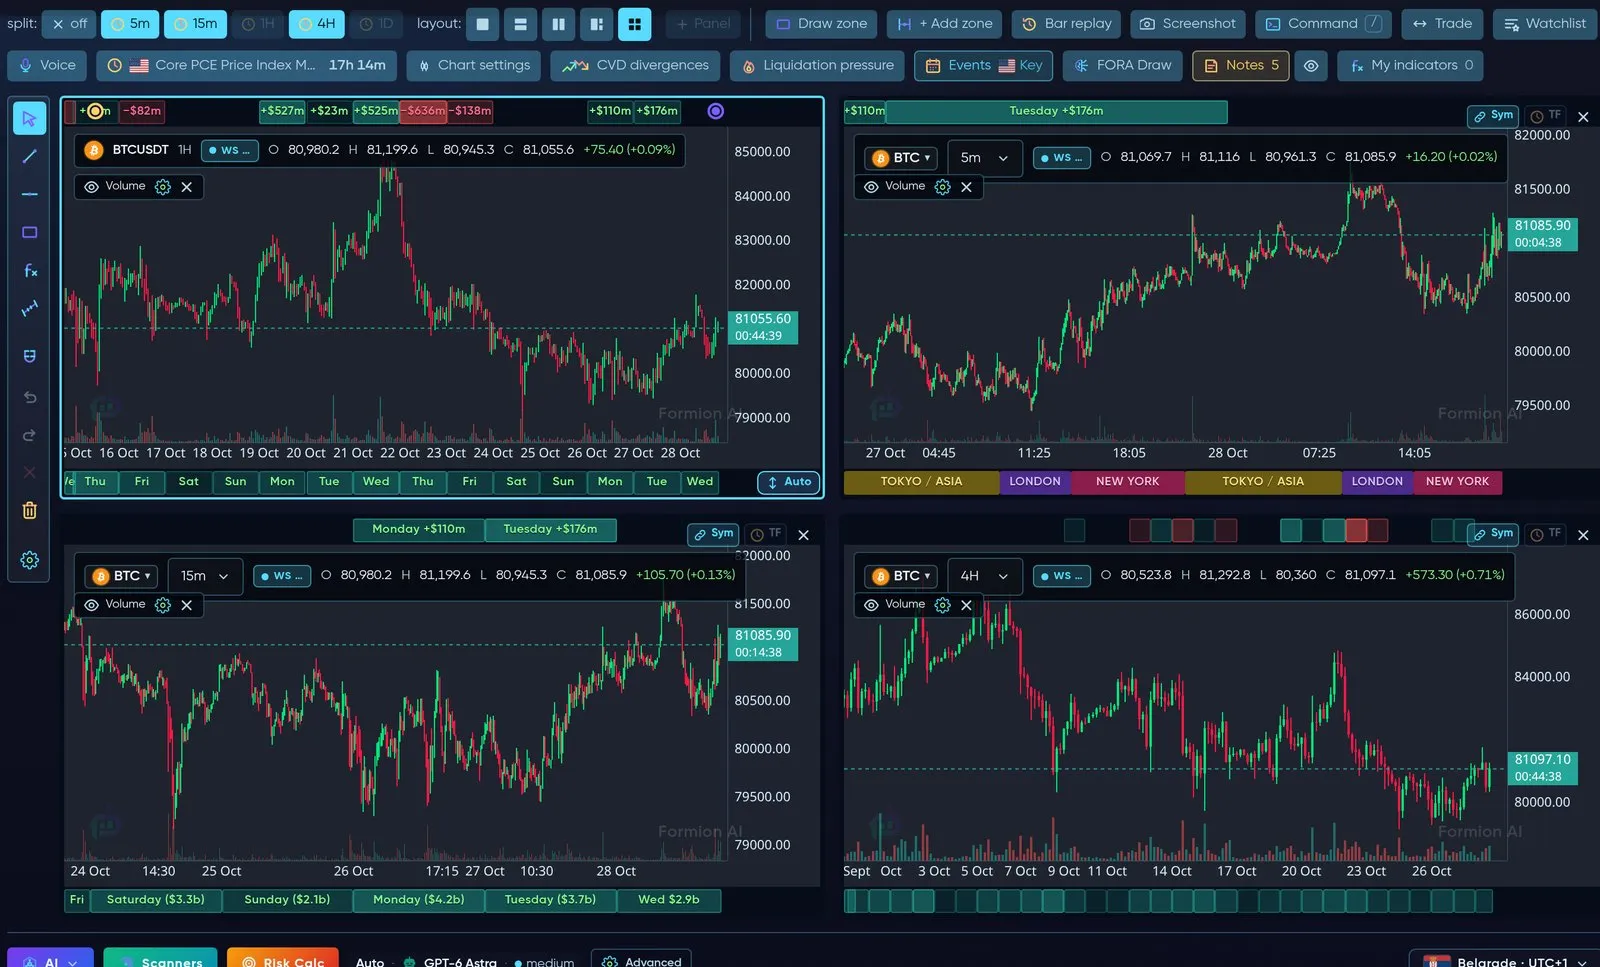
Four charts at once — for example 1h, 15m, 5m and 4h of the same coin.
Events — only the releases that move markets
Section titled “Events — only the releases that move markets”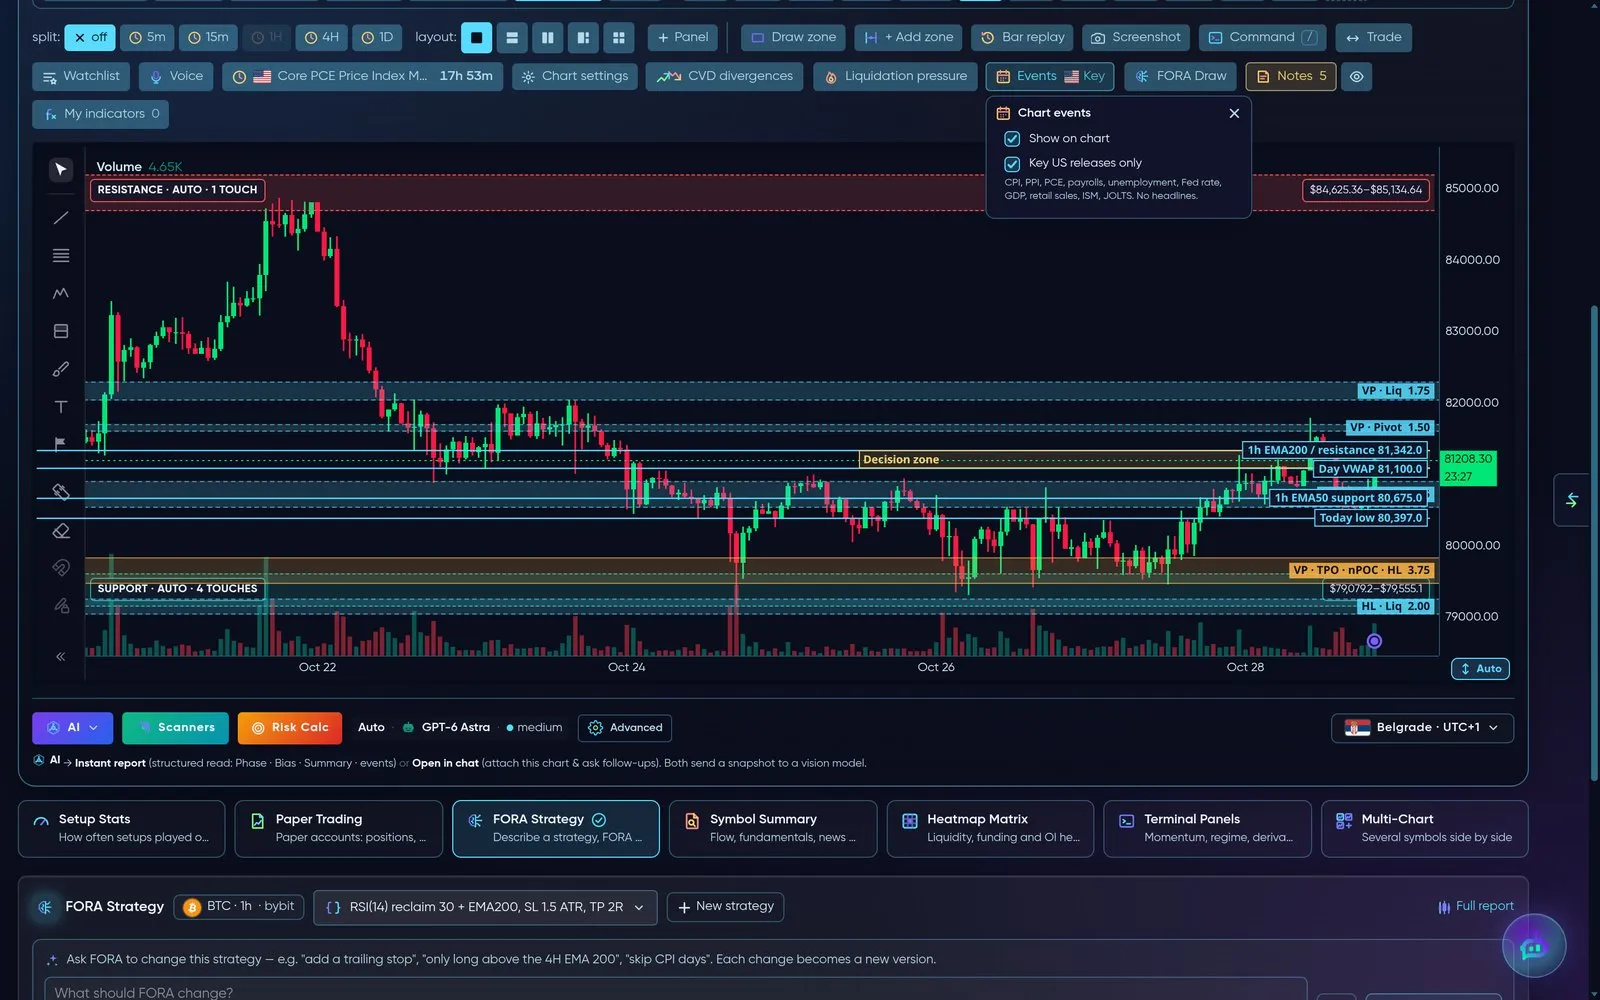
Events shows only key US releases — CPI, PPI, PCE, payrolls, unemployment, Fed rate, GDP, retail sales, ISM, JOLTS. No headline noise.
Trading from the chart
Section titled “Trading from the chart”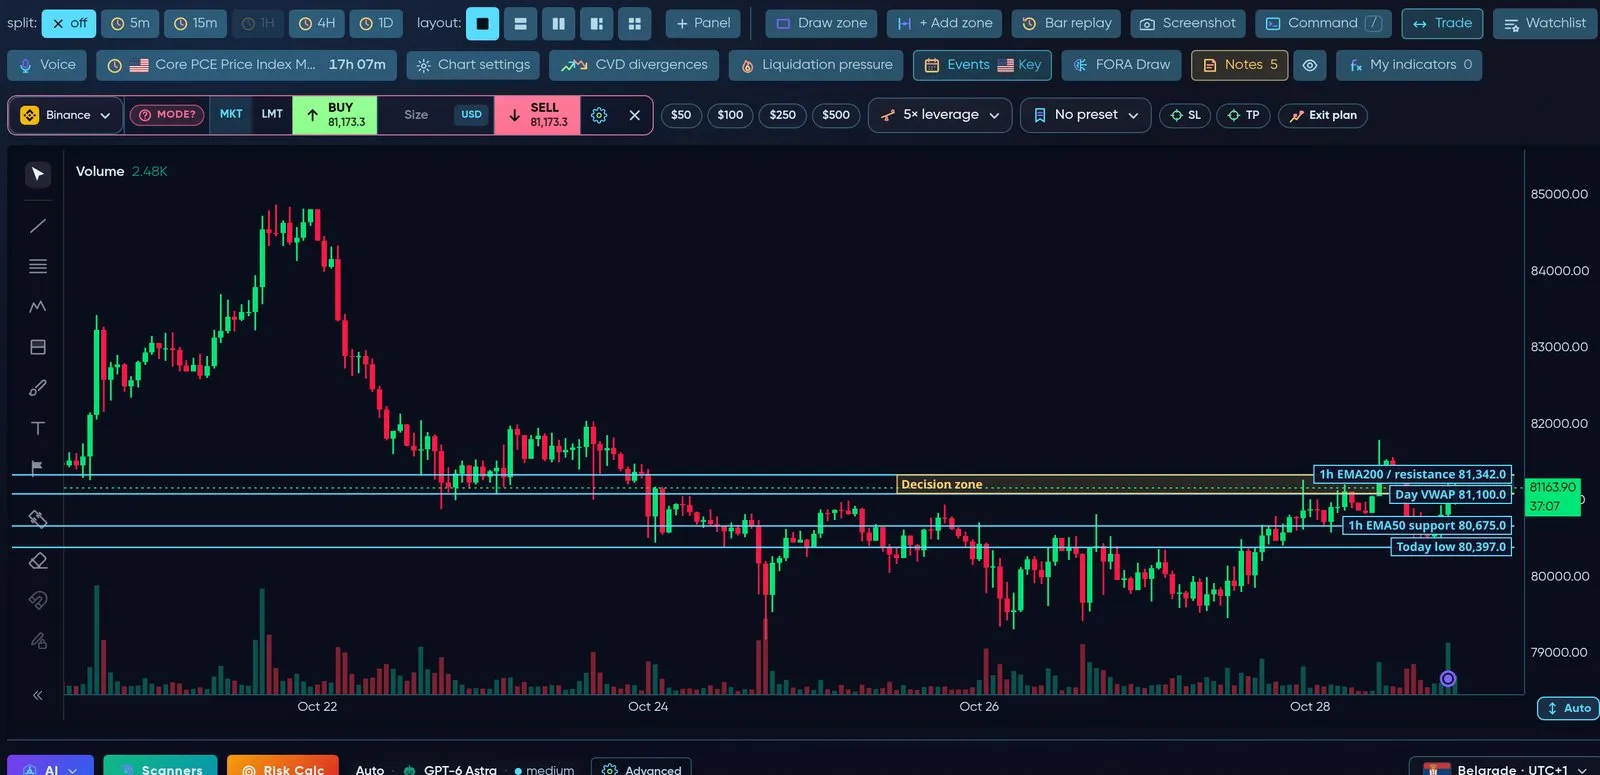
Click Trade: market or limit, size in USD, % of capital or coins, leverage, SL/TP and an exit plan — without leaving the chart.
- Market or Limit — for a limit order click the price on the chart or drag the line.
- Size in USD, % of capital or coins (crypto) and lots or % of capital (
 cTrader); quick-size buttons $50 / $100 / $250 / $500.
- Drag Stop-loss and Take-profit lines; open positions show live P&L and can be closed 25–100 %.
- Every order shows a confirmation with the full plan before anything is sent; the exchange minimum is checked first.
- Works with your connected exchange or broker account — see Brokers & Connections.
FORA on the chart
Section titled “FORA on the chart”FORA 3D — ask about the chart you are looking at
Section titled “FORA 3D — ask about the chart you are looking at”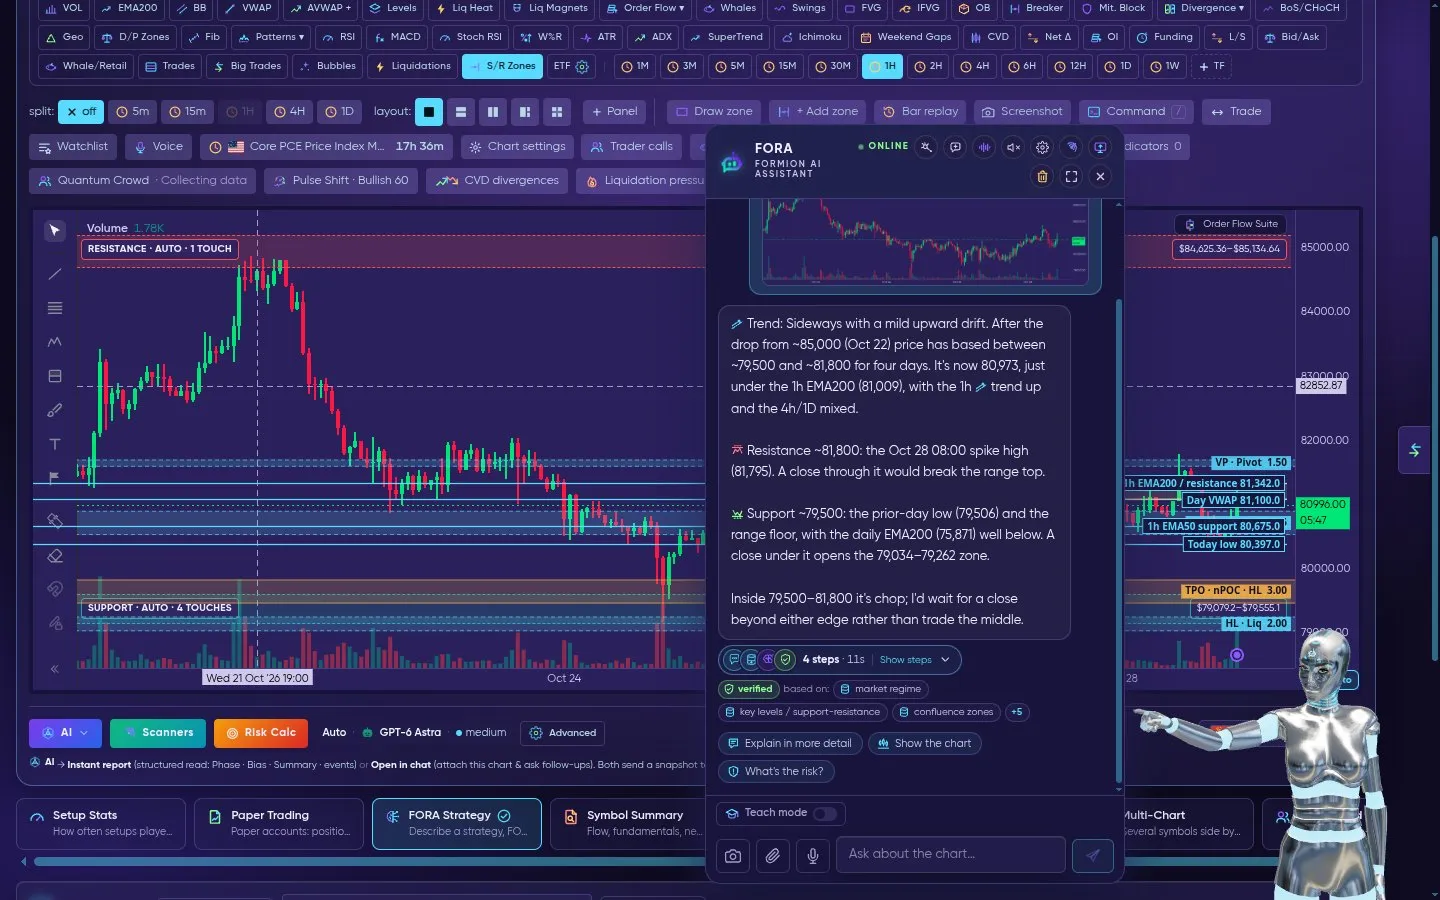
Open FORA (bottom-right): the 3D assistant reads the chart you are on and answers with real levels — trend, resistance, support and what would change the picture.
FORA sees the symbol, timeframe and the chart itself. Ask for an analysis, a setup, to set an alert, or to backtest an idea — she answers with real prices from the chart and shows what her answer is based on. A setup always comes as a card you review — FORA does not open trades on her own. See FORA — Trading Intelligence.
FORA Draw
Section titled “FORA Draw”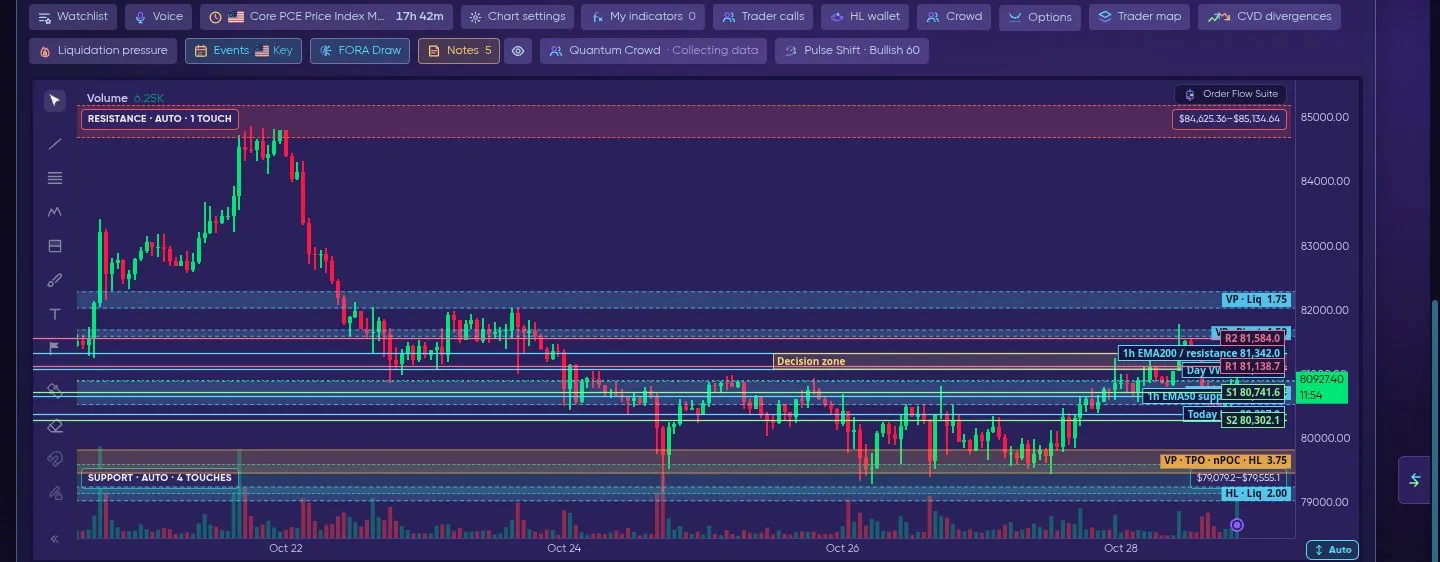
FORA Draw → Support / Resistance: R1, R2, S1 and S2 drawn straight on the chart.
Pick what FORA should draw: key levels, support/resistance, order blocks, FVG, structure, liquidity, sessions, Fibonacci + premium/discount, or everything.
Order Flow Suite
Section titled “Order Flow Suite”Switch on Order Flow in the indicator grid to see what happens inside each candle: bubbles for aggressive buying and selling, traps and absorption markers, and Spot vs perp CVD in its own pane under the chart ( Binance spot and USD-M futures). An amber band marks the moments when spot and perp move in opposite directions.
HL Trade Intent (preview, rolling out) is a pane under the chart with the USD value of new longs and new shorts opened on  Hyperliquid per bar, plus closes on request — turn it on in the HL tab (Show trade intent) or in the Order Flow Suite settings. How it works → Order Flow
OBI history — order-book imbalance under the chart
Section titled “OBI history — order-book imbalance under the chart”The OBI history button in the tools row (off by default) opens a pane under the chart with the order-book imbalance of the market over time, on both engines (Swift and Velocity).
- Imbalance = (bid − ask) ÷ (bid + ask) of resting USD within ±0.10 % and within ±0.25 % of the mid price — two lines, the same bands as Screener → Order Book.
- Positive = more resting buy orders near price, negative = more resting sell orders.
- Each point is a 5-minute average of the order-book snapshot we record on our server (Binance futures book), recorded since early November 2026. Gaps mean nothing was recorded. The pane shows Recorded since with the first date.
- When the recorded book does not reach ±0.25 % of price, that line has no value and the pane says ±0.25% not covered.
- Only recorded crypto perps have a history; on other symbols the pane explains why it is empty. The ✕ hides the pane again.

OBI history under the chart: order-book imbalance within ±0.10 % and ±0.25 % of price, 5-minute averages.
Order-flow Constructor
Section titled “Order-flow Constructor”The Constructor tab (Chart Pro → Constructor) is a dockable, resizable multi-panel layout with order-flow presets: Volume Profile & Footprint, Order book, multi-source order book (Binance,  Bybit,
 OKX, Hyperliquid), DOM ladder, Orderbook heatmap, Tape, Liquidations feed and spoofing / iceberg detection.
Live recording: the Constructor — chart with volume profile, tape and liquidations, zoom in, switch to ETH, then the Heatmap Focus preset.
User Indicator Studio
Section titled “User Indicator Studio”Upload your own Pine scripts and render them on the chart — a Pine-subset compiler handles common scripts, with an AI translation fallback for the rest; both run through the same sandboxed pipeline. Your custom indicators appear in My indicators.